However, when we reached six in the count, we stopped and began to argue: some thought it should be seven next, while others argued for eight.
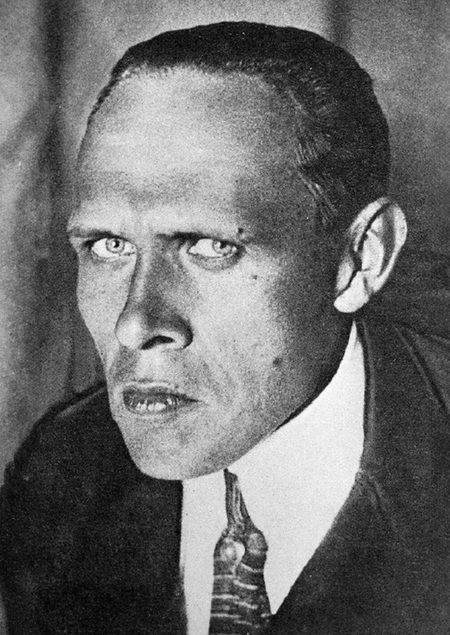
The selection of my topic stems from my personal interest in the work of Daniil Kharms. The idea of analyzing Kharms’s texts not from a purely humanistic perspective, but from a technical one, seemed fascinating, humorous, and fitting for the author’s absurdist nature. For the source material, I chose a collection of short stories from the website lib.ru because it is substantial enough for a thorough investigation.
In this study, I employed line, bar, pie, and scatter plots, selecting them based on the principle of maximum clarity for viewing and analysis.
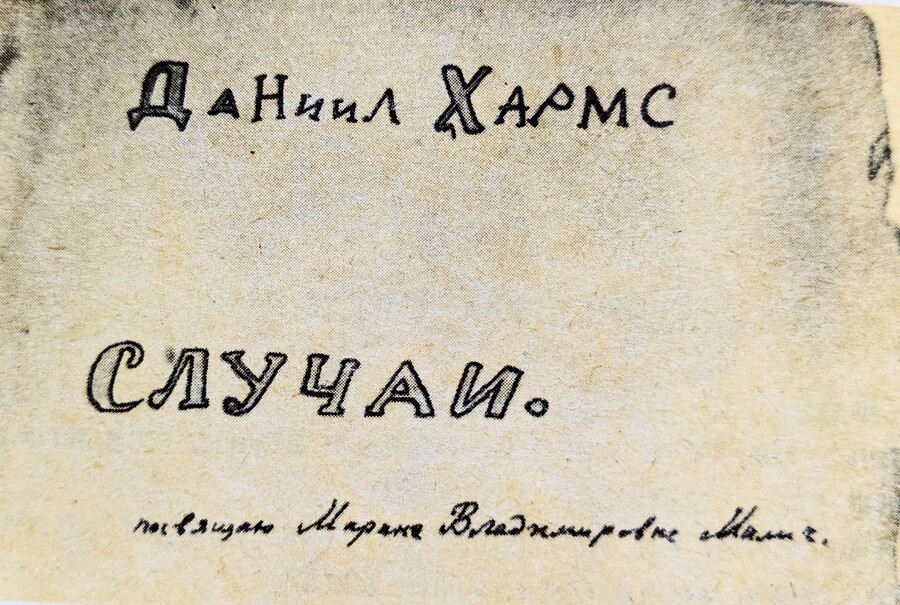
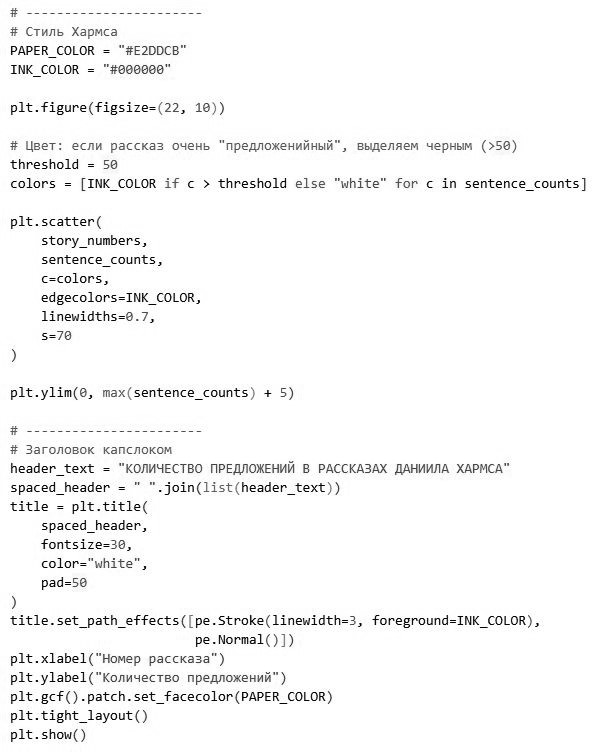
Beige #E2DDCB, White #FFFFFF, Black #000000
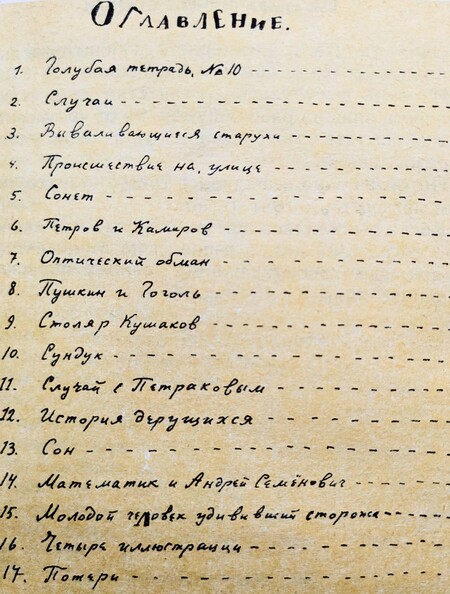
For reference in the design, I chose pages from the «Case Studies» section from the 1930s, featuring the hand-drawn work of Kharm. Based on these examples, I utilized a beige color—evoking the hue of aged paper—a monochrome black-and-white palette, and a slightly increased letter spacing when designing the diagrams.
Words
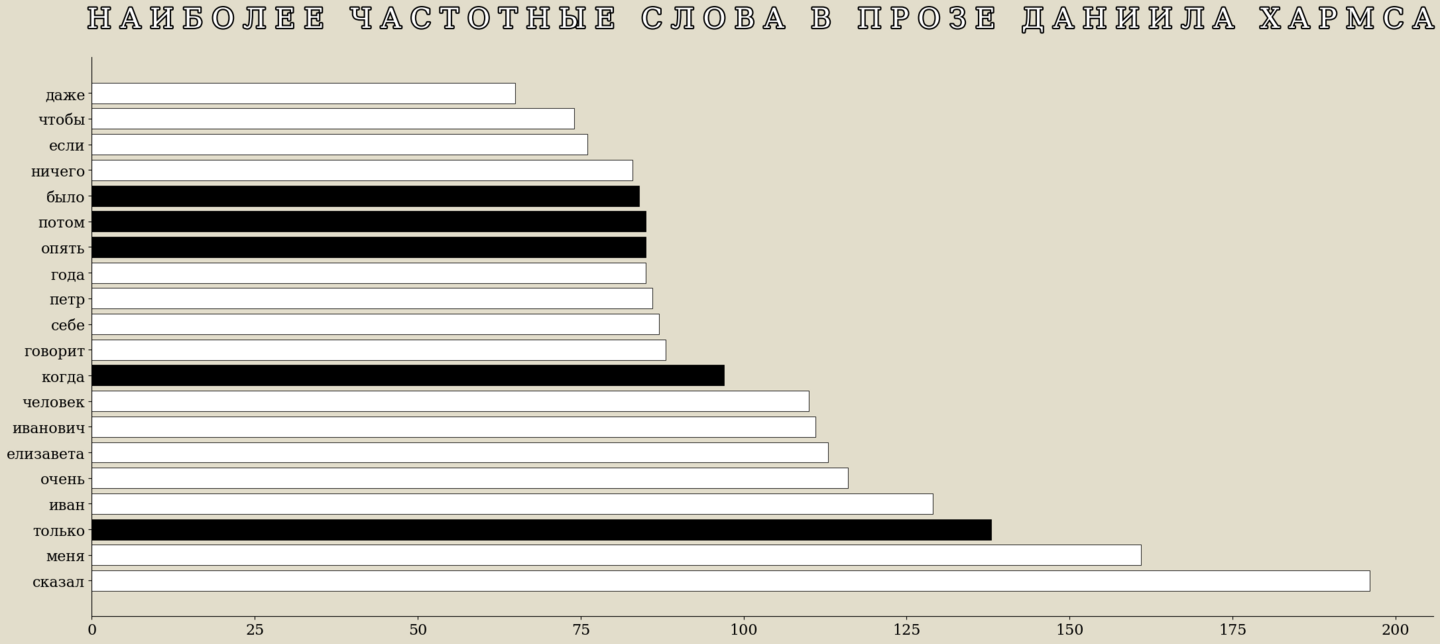
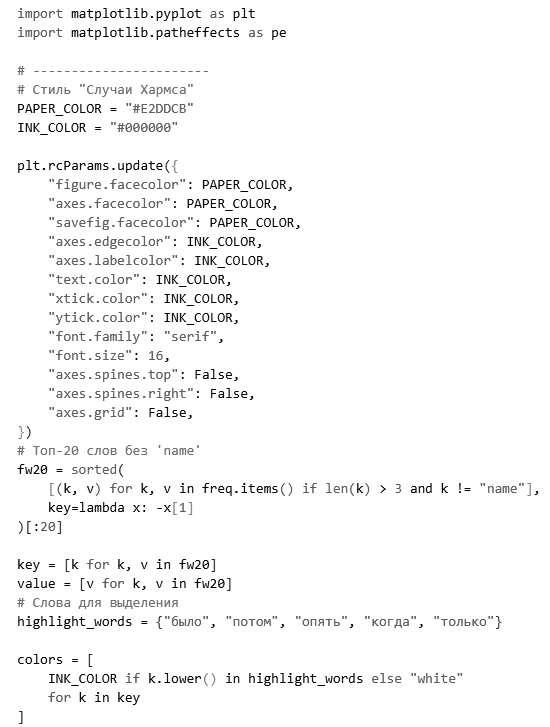
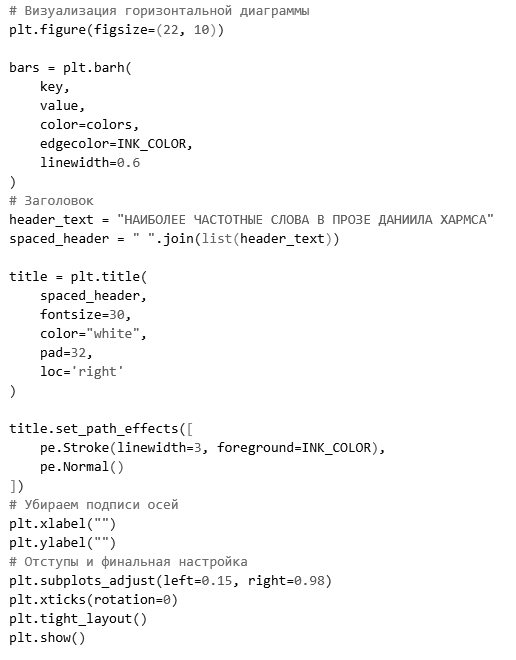
To begin, I decided to calculate which words appear most frequently in Daniil Ivanovich’s texts. A bar chart was perfectly suited for this, as its layout ensures the most comfortable reading experience for the words. The bar chart clearly illustrates the difference in word frequency.
Punctuation
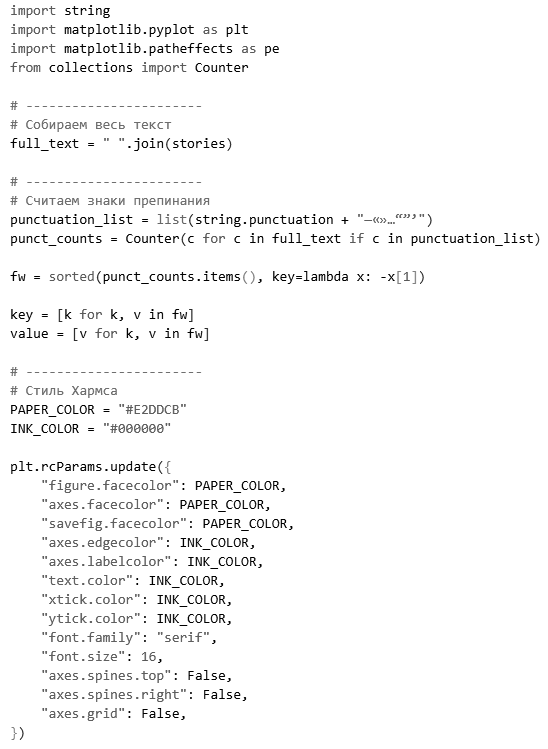
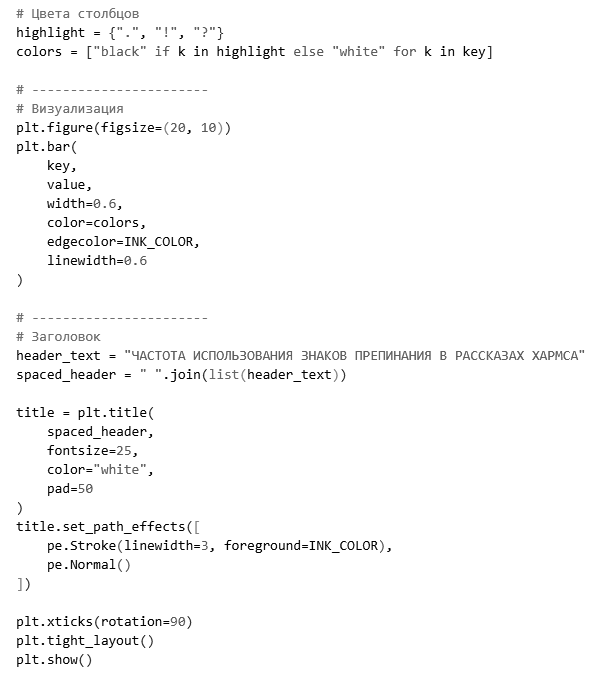
Next, I became interested in which punctuation marks the author uses most frequently. I paid special attention to the period, exclamation point, and question mark, as these marks carry the most emotional weight. The bar chart visually illustrates the differences between the types of marks.
Death
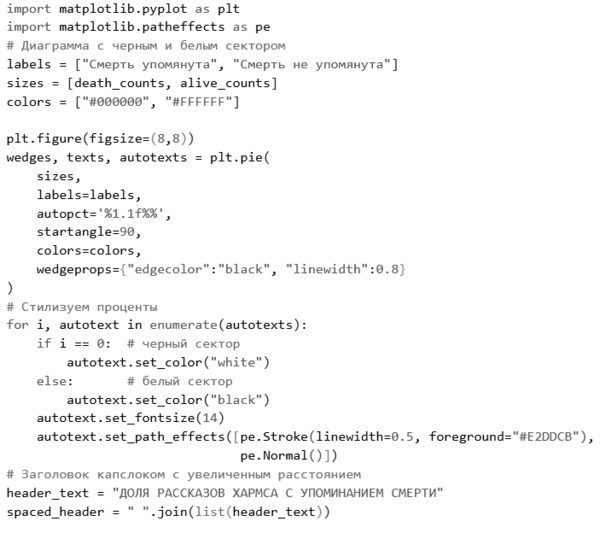
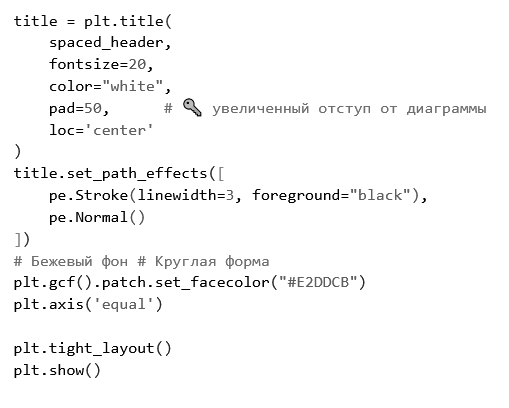
Death is a very important character in Daniil Ivanovich’s stories. I became curious about how often she appears in his tales. The pie chart clearly illustrates this proportion.
Rhythm
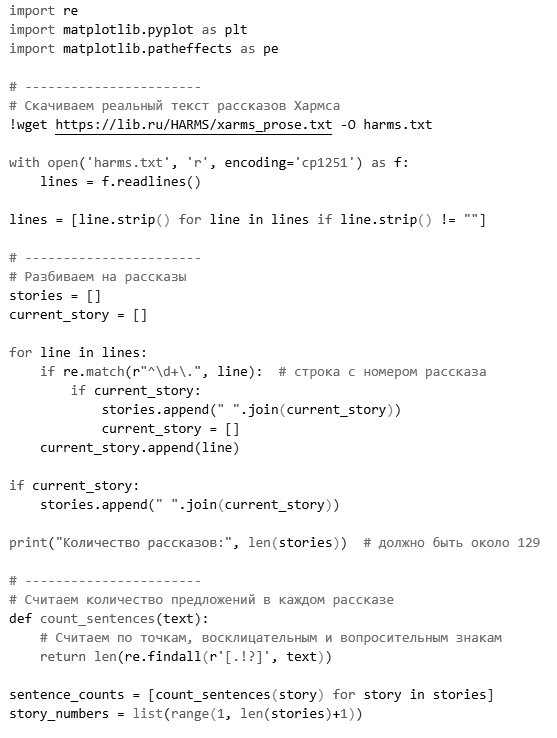
The dot plot allows you to track the length of each story and form a picture of the overall length of the works.
Conclusion
Analysis of Daniil Ivanovich Kharms’s short stories revealed key features of his writing. A line chart identified the most frequently used words, a bar chart showed the preferred punctuation marks—especially emotional ones—and a pie chart demonstrated the part of the stories where the theme of death appears. A scatter plot illustrated the variation in the length of the works. Thus, visualization and frequency counting allowed for a clear presentation of Kharms’s textual style, rhythm, and themes.
I used ChatGPT to write the code. Prompt example: «I have texts of Daniil Kharms’ short stories. How can I count how many stories are related to death using Python? Please provide the code.»