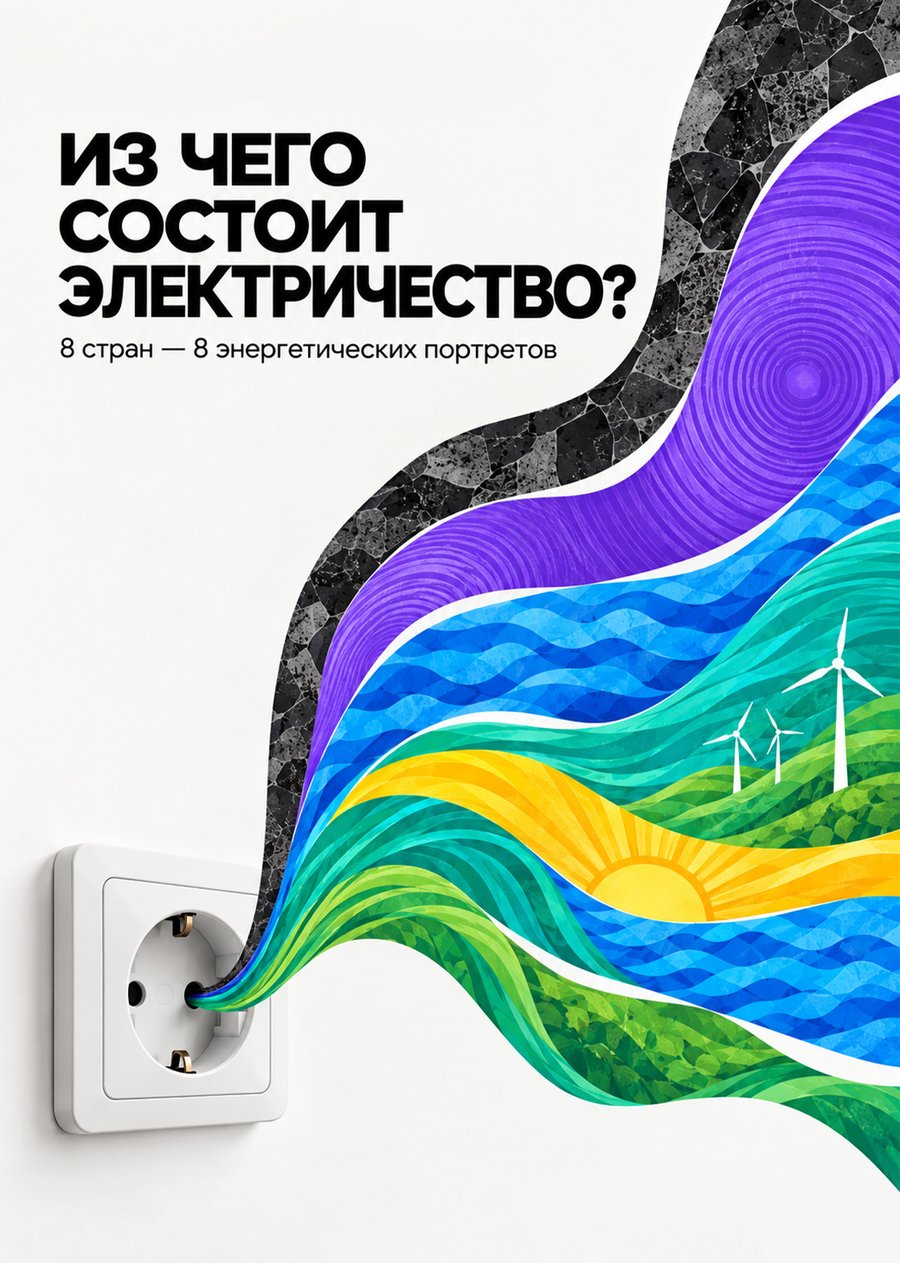
The project, «What Is Electricity Made Of?», illustrates the varied ways that electricity is generated across different countries. We use electricity every day without giving much thought to its source, even though the same outlet can be connected to vastly different energy sources. To provide a comparison, eight countries with contrasting energy profiles were selected. The infographic displays the share of fossil fuels, nuclear power, and renewable energy in total electricity production. Using percentages allows for a fair comparison across countries of different sizes. The goal of the project is to make complex energy data comprehensible and visually accessible. The infographic helps viewers quickly grasp the differences between nations and understand what our everyday electricity is truly composed of.
Data on the electricity production structure in eight countries—France, Norway, Denmark, Iceland, Germany, China, India, and the U.S.—were used for this project. All data was sourced from Our World in Data.
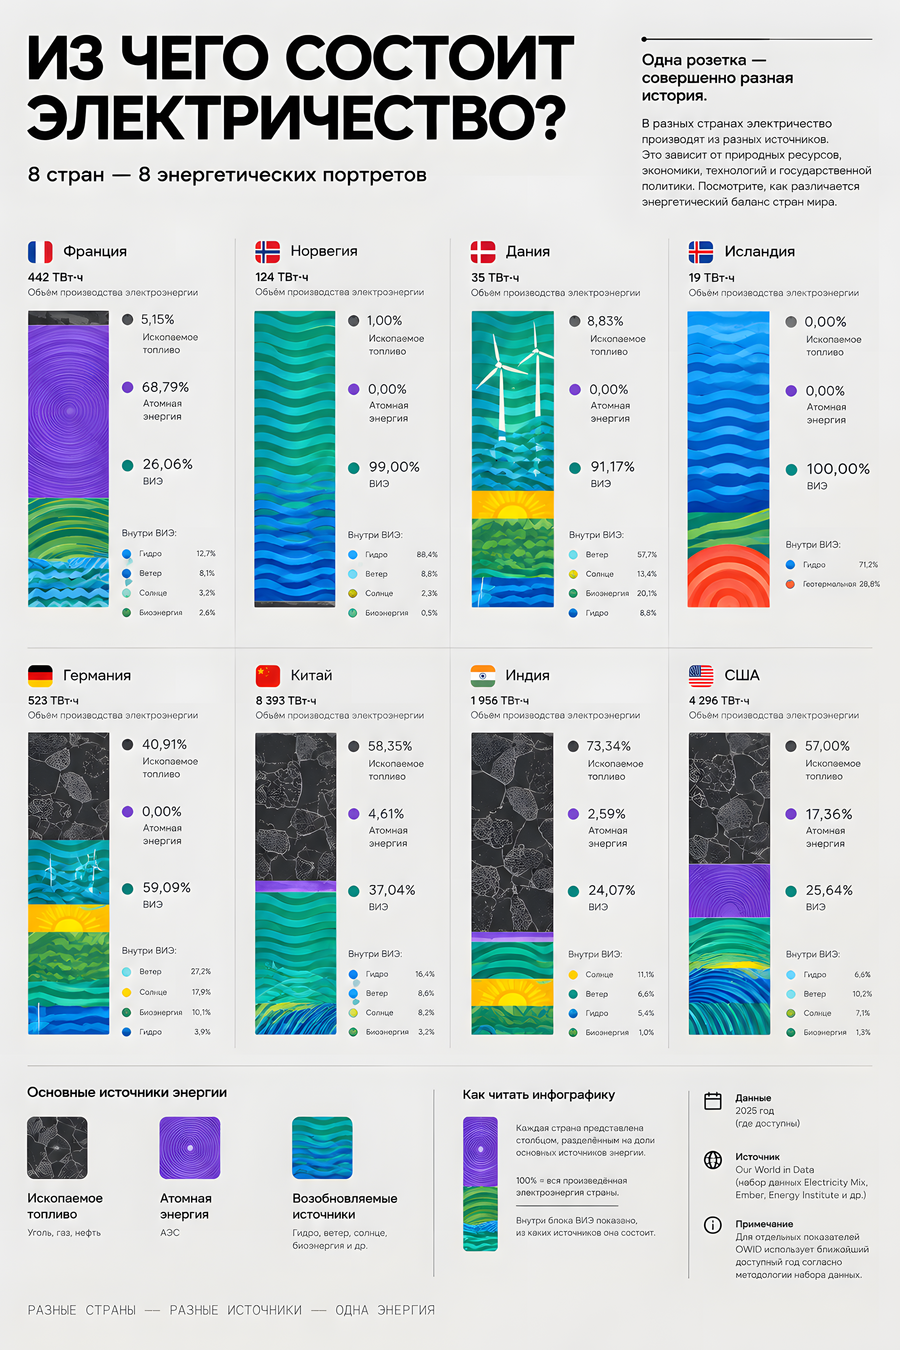
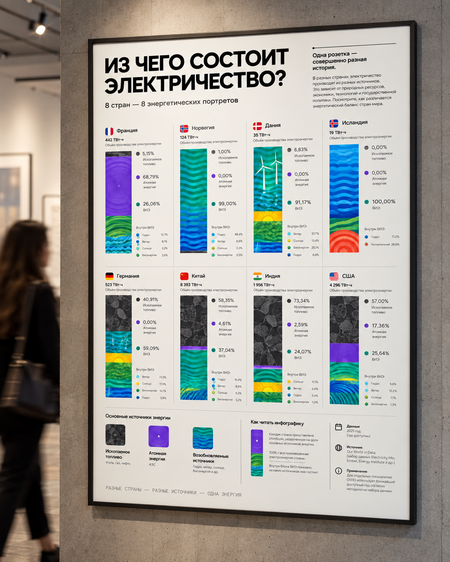
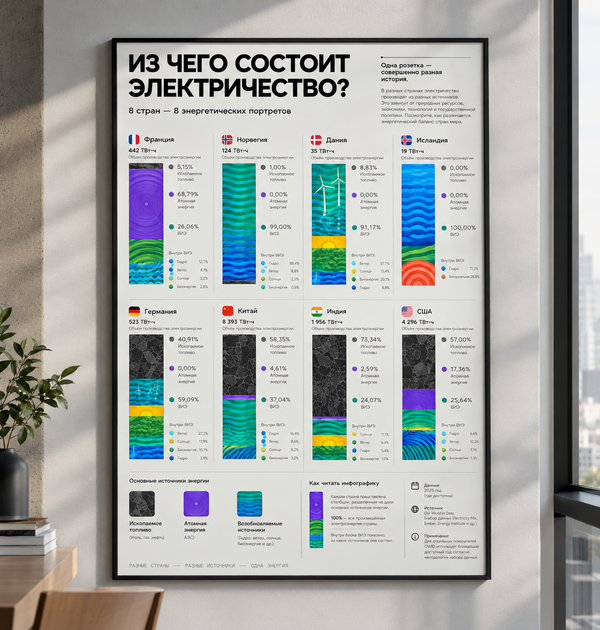
The project began with topic selection and the search for an open-source dataset. The foundation was the Our World in Data dataset, which contains the structure of electricity production by country and source. The data was filtered for eight selected countries and standardized into a unified comparison system. Subsequently, the sources were grouped into three main categories: fossil fuels, nuclear energy, and renewable sources. Within renewables, hydro, wind, solar, bioenergy, and other generation types were further specified. Next, the data was translated into a visual system. Each energy source was assigned a unique graphic pattern, and the size of each block on the poster corresponds to its share in the country’s energy balance. After developing the system, the poster composition, typography, legend, and annotations were finalized.
ChatGPT-5.6 Sol was used throughout the process. The AI tool was utilized to search for open databases on the chosen topic and to generate interior photographs for use in creating mockups.