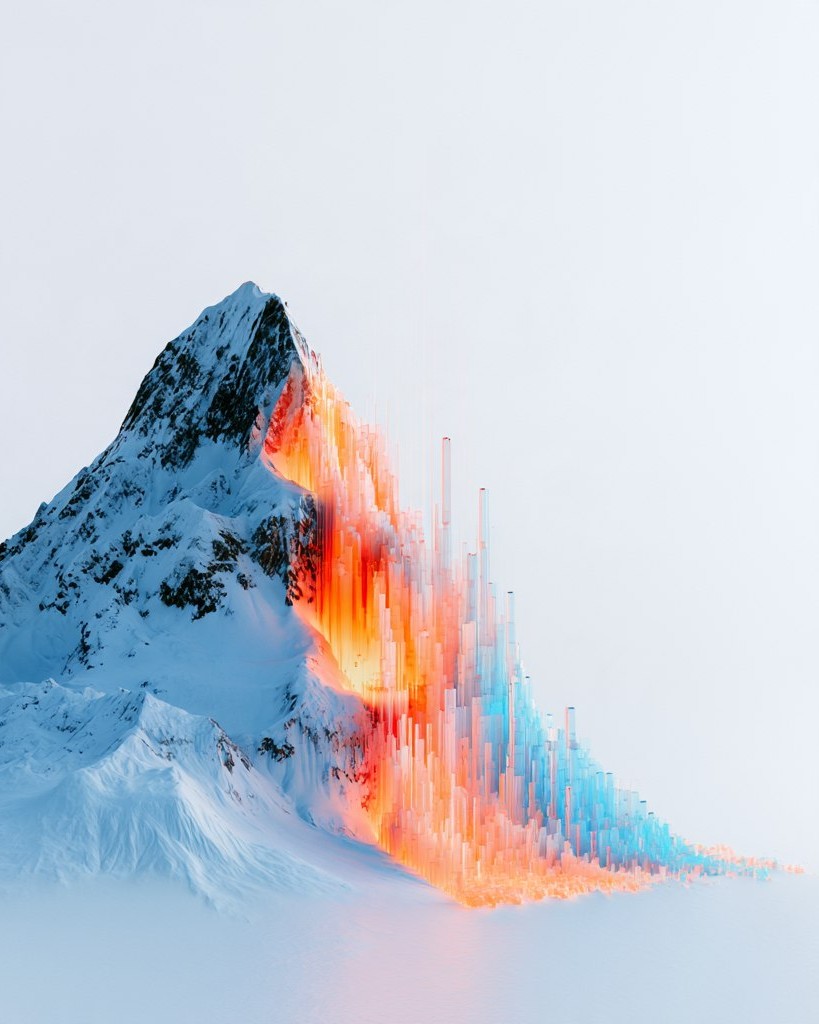
Concept
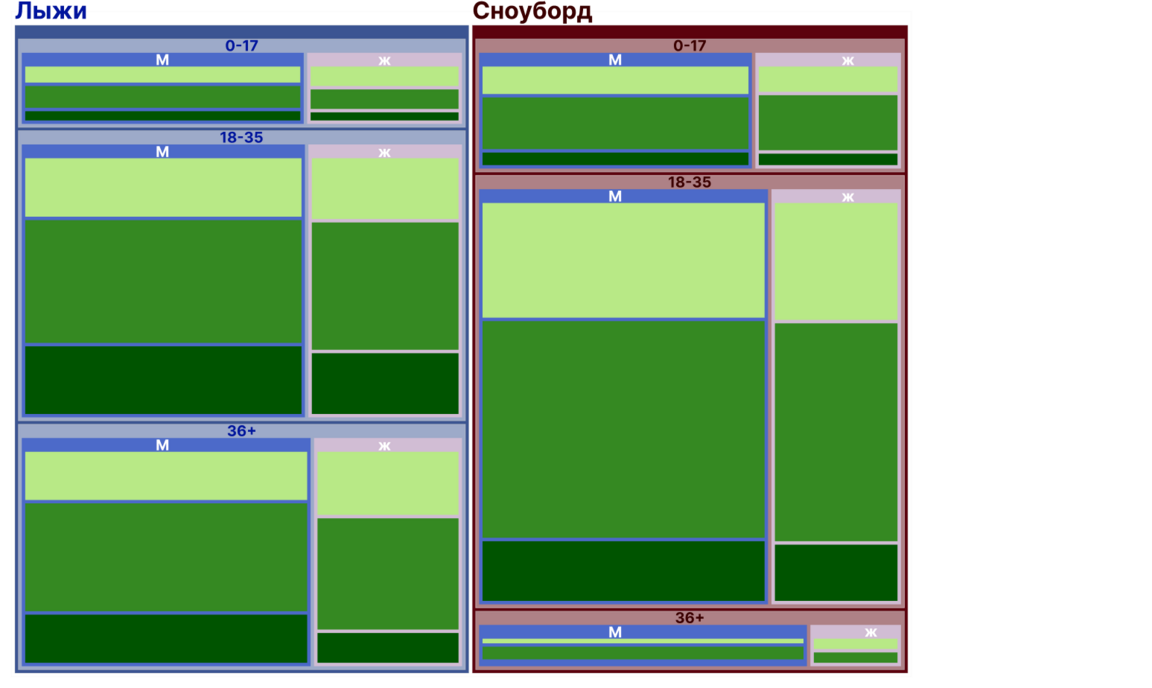
The project is a visual and analytical study comparing two major winter disciplines—skiing and snowboarding. At first glance, they appear similar, but the physics of motion, foot-binding mechanics, and riding style differ drastically. The project’s idea is to use a unified visual ecosystem and a strict data grid on an A1 poster format to demonstrate how equipment choice directly shapes the riders' age profile, load characteristics, and specific risk zones on the human body.
Project Goals and Objectives
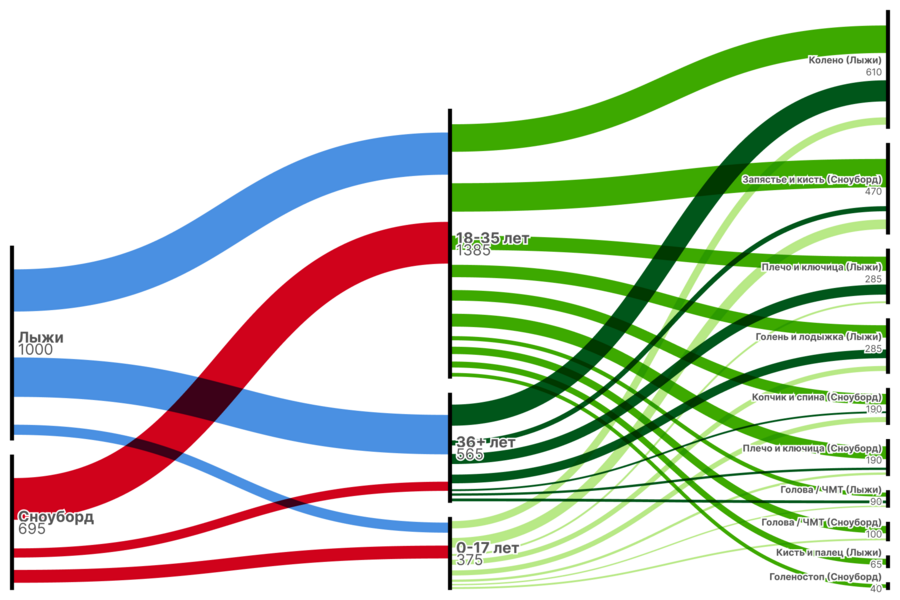
Goal: To visually demonstrate demographic differences and identify the relationship between the sport, the rider’s age, and the location of injuries sustained.
Objectives: ◦ Profile ski and snowboard participants by age, gender, and frequency of injury. ◦ Visualize the «risk pathway”—from gear selection to specific anatomical injury site. ◦ Formulate clear, data-driven recommendations for protection and safety.
Practical Application
The project serves as a visual safety guide for sports and tourism complexes, gear rentals, specialized media, and riders themselves, helping users make informed decisions when selecting protective equipment.
Pipeline
The project creation process included five sequential stages:
Data analysis and extraction of key metrics from a scientific article: gender, age, injury location, severity.
Generating base graphs in RAWGraphs, experimenting with chart types, and exporting vector SVG files.
Graphic design and layout: ◦ Constructing a modular grid for the poster ◦ Selecting appropriate typography and color palette ◦ Aligning columns, managing font contrast on colored backgrounds, and refining labels on the Sankey diagram
Content integration: laying out informational cards on prevention, headings, and analytical excerpts.
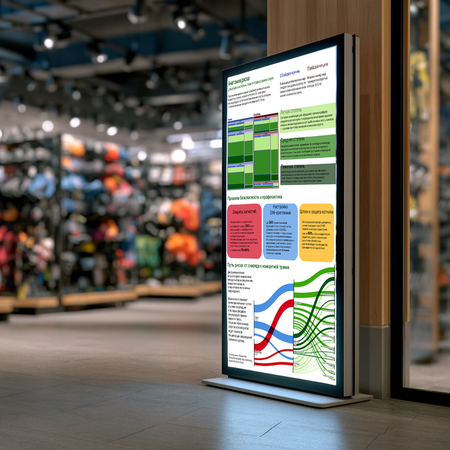
Finalization: previewing the completed poster on mockups and compiling the final long-form article.
Schedules
Infographic
Mockups
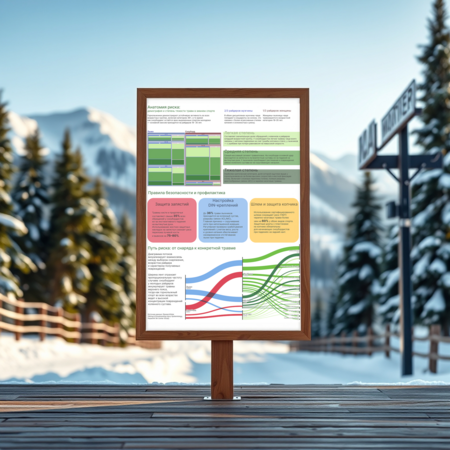
For foundational research, we utilized data from a four-year retrospective observation of the trauma center at the Copanik ski resort (ResearchGate: Recreational skiing- and snowboarding-related injuries).
Representativeness and Depth: The study encompasses a complete four-year period of continuous observation of patient cases within a single major resort.
Detail Level: The dataset contains not just an overall rate of trauma, but precise cross-sections by age, gender, severity, and specific types of joint/bone injuries.
Real Clinical Experience: The foundation of the data comprises actual visits to the emergency department, which excludes subjective assessments and provides an accurate medical picture.
Tools
When working on the project, a modern pipeline incorporating artificial intelligence was applied at every stage: ◦ LLM (ChatGPT): analysis, cleaning, and initial grouping of raw medical data from the study.
◦ RAWGraphs (Data Visualization Engine): algorithmic construction of complex visual structures, such as Treemap diagrams and Sankey flow diagrams.
◦ Midjourney: generation of conceptual visual references for the longread cover and mockups.