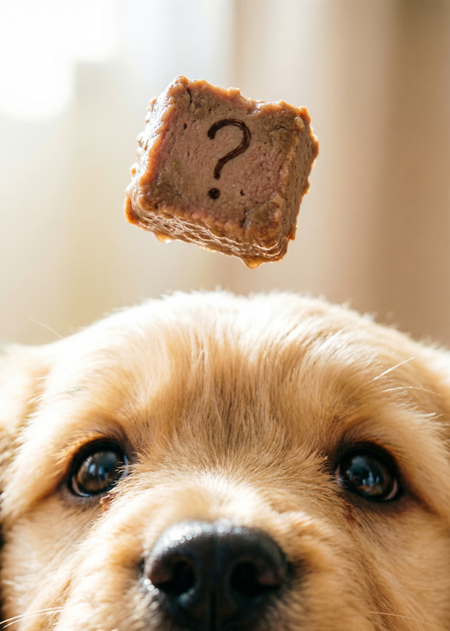
Project Description
The topic of pet food quality remains one of the significant issues faced by every pet owner. There are thousands of products on pet store shelves, but far from all of them are genuinely beneficial. Many owners choose food based on price, advertising, or attractive packaging, without considering what is inside. However, nutrition directly impacts the animal’s health, lifespan, and overall well-being.
This topic is close to my heart because I love animals and I am also a pet owner.
Project Goal — to use data visualization to reveal what is truly hidden in the food for our furry companions.
The practical benefit of this project is that it helps pet owners approach food selection consciously. The infographic clearly demonstrates that sugar in pet food is a reality, not a myth, and that only about one-fifth of the products on the market receive a good rating.This poster can be used in veterinary clinics, shelters, and pet stores as a visual guide when reading ingredients.The infographic encourages people to think again about pet food quality without targeting specific brands, which helps avoid conflicts.
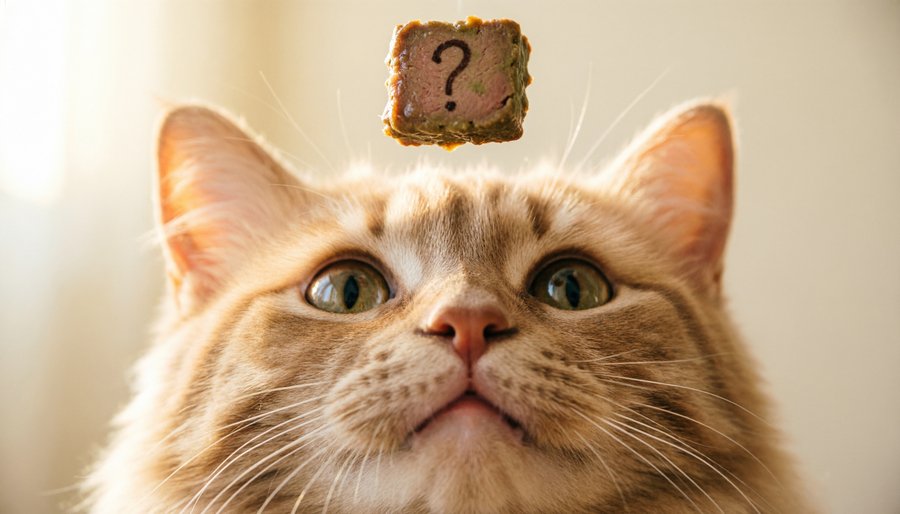
Generation: Qwen AI
Source Data
The work utilized the open dataset Open Pet Food Facts, published on the Kaggle platform. This dataset contains information on the ingredients, caloric content, and ratings of thousands of pet foods.For the infographics, metrics that most thoroughly reflect the main aspects of the food quality issue were selected: macronutrient composition (protein, fat, carbohydrates, moisture), the caloric content of dry and wet food, sugar content, and the distribution of foods according to the Petscore rating.
The Creation Process
Data analysis and graph generation were performed in the Google Colab environment using Python.
The metrics selected for the infographic were chosen based on their ability to most comprehensively address the issue of pet food quality.
The following libraries were used in this work:
matplotlib.pyplot — for generating charts, and font_manager from the matplotlib library — for integrating and configuring fonts on the graphs.
The metric values were sourced from the public Open Pet Food Facts dataset (Kaggle) and were averaged by category. Four charts, unified into a single poster, were constructed based on these values.
Generated by: Qwen AI
Based on the processed data, a visual concept for the project was developed: colors were defined, fonts were selected, and the logic of the graphic elements was conceived. Illustrations of animals were created using the Qwen AI neural network.
Posters and Carriers
The visual design is built upon muted shades of brown with olive accents, creating a feeling of naturalness, care, and friendliness.
Classic illustrations—paw prints and a dog with a bone—clearly evoke the image of a beloved pet.
The minimalist design allows focus to remain on the infographics without distracting the eye.
Generated by: Storico.com
Generation: Qwen AI
Generated by: Qwen AI
Generated by: Qwen AI
Analysis showed that only one in five foods receives a good rating, and a quarter of market products have low ratings. The sugar content in some foods reaches 29g per 100g, comparable to desserts, and dry food is almost 3.5 times more caloric than wet food. This suggests that we need to examine the ingredients list more closely before feeding your pet.
Tools
Kaggle — data sourced from Open Pet Food Facts.Google Colab — data analysis and visualization.Qwen AI — illustration generationStorico.com — generating the illustrative components of the infographicGoogle Fonts — utilizing the Nunito typeface.