Topic
The day I was choosing the theme for the project I would be working on next, I was suffering from a headache yet again. Literally.The thing is, I am somewhat weather-sensitive, and at that particular time, I was feeling the impact of another geomagnetic storm.This is why the study of this phenomenon became the focus of my attention.
Sun and Earth
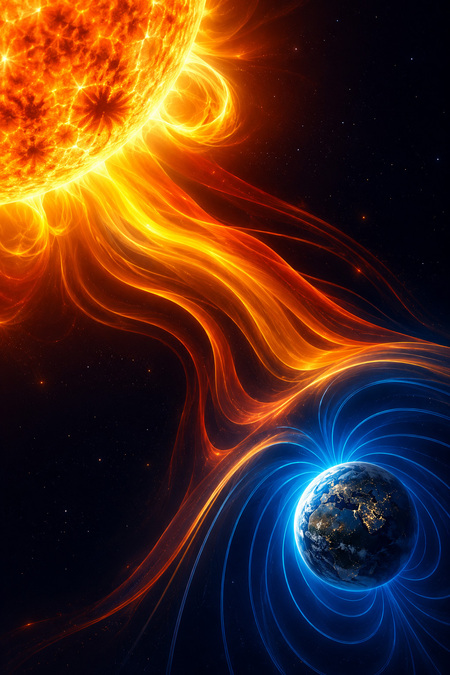
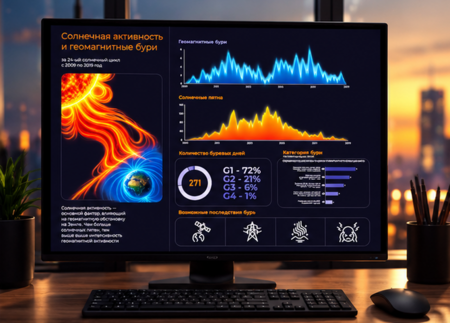
The activity of our star—the Sun—significantly influences the geomagnetic environment. In turn, the Sun’s magnetic activity can be judged by the number of dark spots visible on its surface.Visualizing data on these phenomena across the 24th solar cycle has become the main subject of our infographics.
Sources and Data Handling
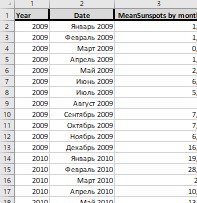
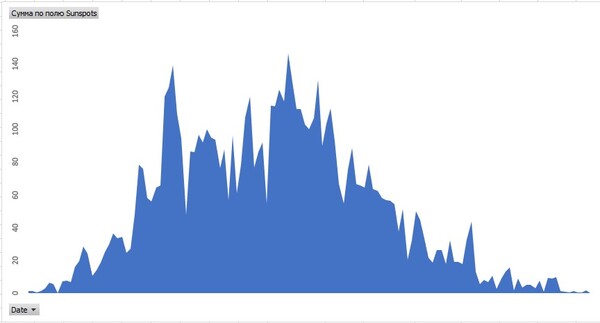
First, data on sunspots was collected. The target parameters were the average monthly value throughout the entire cycle: from 2009 to 2019.
Using MS Excel, data for each month was extracted from the initial dataset. A chart was then constructed based on this data.
Next, the geomagnetic activity data was processed. Using the information from eight three-hour readings for each day, the days where the average daily reading was equal to or greater than 5 were identified.
Following this, data regarding the count of such days in each month of the studied period was aggregated. A corresponding chart was also created based on this information.
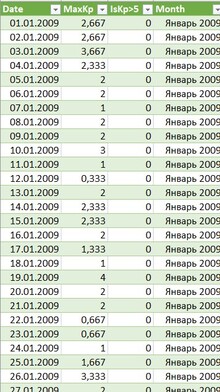
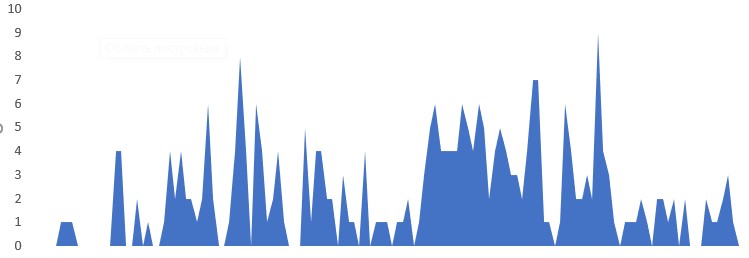
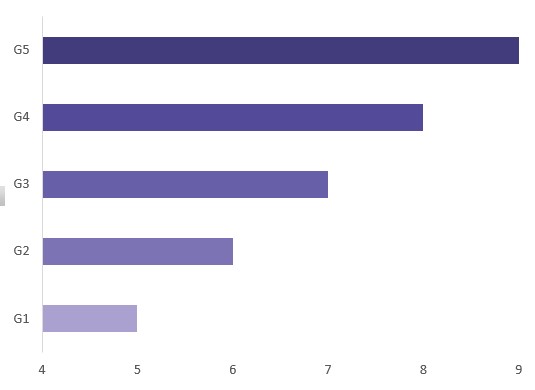
The significance of Kp $\ge$ 5 was not arbitrary—this index specifically characterizes a storm (rather than mere activity), according to data from the U.S. National Oceanic and Atmospheric Administration (NOAA).
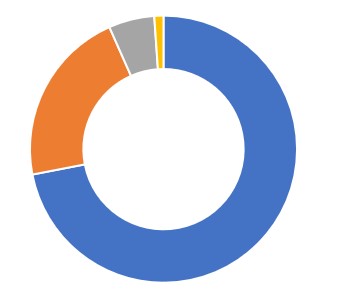
A corresponding diagram was created to visually illustrate this scale. Furthermore, based on data regarding geomagnetic activity, another pie chart was developed that incorporates the number of storm days broken down by intensity.
Infographic
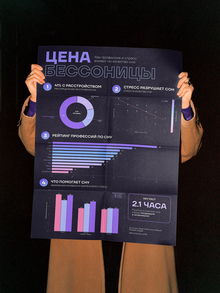
The data obtained was compiled onto a single mockup using Figma and Adobe Illustrator.
The diagrams themselves, used to create visual effects, as well as additional graphics and illustrations, were created using the following tools:ImageGen from OpenAI powered by GPT-6 Nano Banana Midjourney
Mockups
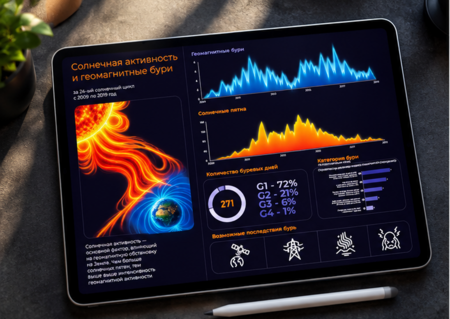
Mockup generation was carried out using ChatGPT-6