
In this project, I am analyzing data on the impact of artificial intelligence on various professions, utilizing the ai_job_replacement_2020_2026_v2.csv dataset. It contains information regarding salaries before and after AI implementation, as well as data segmented by country and profession.
The primary objective of this work is to compare how salary levels change across different professions and countries, and to determine which professions are most susceptible to the influence of AI.
Visualization
The project’s visual design is executed in the style of a digital system interface, drawing inspiration from the aesthetics of artificial intelligence and analytical dashboards. A dark background, mimicking a terminal screen, serves as the foundation, while neon green and blue are used as accent colors, associating them with digital technology and data processing.
Data Upload
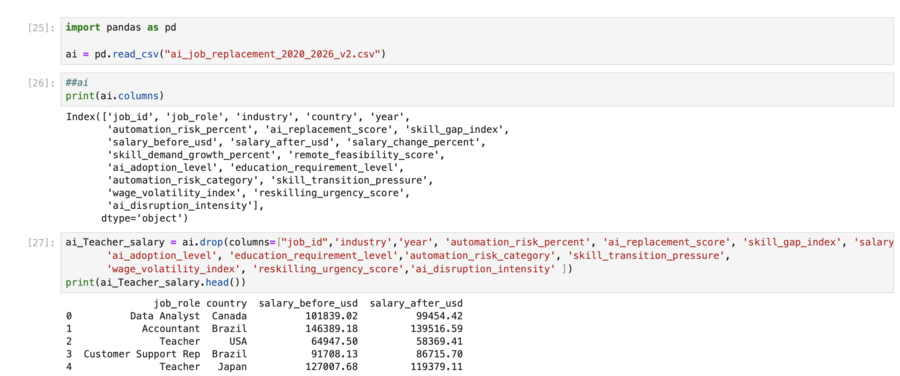
Data processing began with loading the dataset using the pandas library. The original dataset contained numerous technical features (automation index, AI substitution score, skills gap index, etc.) that were not required for the main analysis. Therefore, only the necessary columns were selected from the dataframe: job role, country, salary before AI adoption, and salary after AI adoption. This allowed us to focus on the key metric—the change in compensation levels influenced by artificial intelligence.
Data Processing and Graphing
Bar chart
Line Graph
Horizontal Bar Chart
Dot Plot
Conclusion
The use of different chart types allowed for a clear comparison of salary changes across countries and professions. It is evident that there is no single trend—the impact of AI varies depending on the region and specialization. The greatest positive effect is observed for data analysts in Brazil and Germany, as well as for teachers in the United Kingdom. Meanwhile, some countries (Canada, the U.S.) are showing salary decreases in certain professions.
During the project execution, neural network tools (ChatGPT) were utilized to refine code syntax and select optimal visualization parameters. These tools helped determine color schemes, configure chart styles, and improve element placement to enhance clarity and design consistency.