
In today’s environment, the growth of social media presents marketers, press service staff, and PR specialists with the task of monitoring product image and brand health across major social networks. This task is particularly relevant for representatives of the FMCG segment, where understanding consumer needs and tracking market reaction is required on an ongoing basis. Classic methods for studying attitudes toward a product or brand include consumer surveys in various formats, focus groups, and other research methodologies. Although these methods yield relevant results, their drawbacks include complex organization, high execution costs, and lengthy timelines. The SML method—analyzing consumer opinions on social networks—allows for this complex task to be completed quickly and at a lower cost, and can serve as one of the auxiliary methods for studying consumer preferences.
We conducted a comprehensive analysis of the corpus of user messages during the research period. Our report includes quantitative and qualitative characteristics of the messages, as well as the results of the qualitative analysis of key themes and mentions.
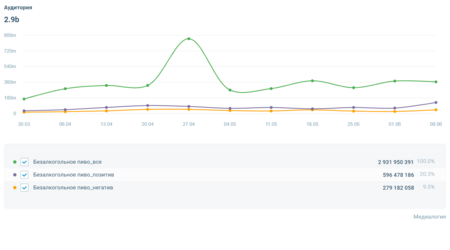
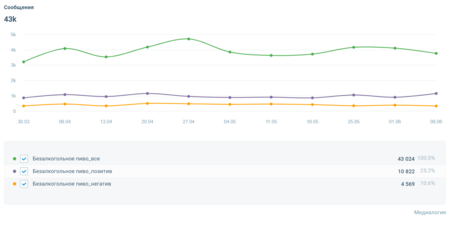
Through machine monitoring by Medialogy during the research period, 7,487 positive and 3,444 negative unique messages were identified (positive — 23,3%, negative — 10,7%, the remaining 66,0% were neutral/informational).
The «messages» chart illustrates the intensity of discussions and the dynamics of the total, positive, and negative volumes. The overall volume remained stable: around 3.2 thousand at the start, peaking at approximately 4.7 thousand around April 27th, and settling at approximately 3.8 thousand by June 8th. The positive line (approx. 850–1,150 per week) mirrors the overall trend, showing peaks around April 20th, May 25th, and June 8th, which suggests a sustained positive sentiment. The negative line (approx. 350–550 per week) is lower and stable, indicating existing critical perception points.
The chart provides a quantitative basis; however, to understand the reasons behind the positive or negative evaluations (such as taste, price, composition, consumption scenarios, etc.), further content analysis is required.
The «classrooms» schedule shows potential message reach, not the number of opinions. The overall reach is 2.9 million: positive — 596 thousand, negative — 279 thousand, and the remainder are neutral/informational. The positive audience is approximately 2.1 times larger than the negative, meaning positive sentiment not only appears more frequently but is also more visible.
Overall, the audience confirms the prevalence of a positive tone.
Field data is available for 46,5% of authors, so the results are approximate. Among them, men account for 55,6% (8,242 authors), and women account for 44,4% (6,581). There is a slight male majority (a difference of 11.2 percentage points), but the female representation is significant—the discussion is gender-mixed.
Discussions are concentrated on social media and messengers: Telegram chats (10,724), VKontakte (10,345), and Telegram channels (5,472) account for approximately 61,6% of all messages, while Telegram and VKontakte generate about 65,2% of positive mentions and 51,4% of negative mentions. Feedback on marketplaces and specialized platforms (Wildberries, Irecommend, Yandex.Market, Otzovik, Yandex.Maps, Untappd) constitutes a small volume, but it holds high qualitative value for understanding the actual consumer experience.
We employed a mixed-methods approach: quantitative data from media analysis, manual vetting of notable publications, and analysis of frequent words, hashtags, and emotional markers.
Positive sentiment surrounding the product is tied to taste, perceived utility, and recognizable brands; conversely, negative sentiment primarily relates to price and economic factors.
The emotional metrics served as a supplementary indicator and did not replace substantive analysis. Based on these findings, recommendations for adjusting the communication strategy have been developed.
Non-alcoholic beer has become a trend because it merges the demand for health and consumption control with the maintenance of social rituals, enhanced taste quality, and active media presence. For communication, it is crucial to position the product as its own category, emphasizing taste, real-life consumption scenarios, and clear value—rather than merely as an «alternative» to alcohol.