Designers are the necessary people to create beautiful pictures and convenient applications. Few people know how to design and qualify, even the designers themselves sometimes know how to do so much that their eyes run… to avoid impostor syndrome and to appreciate themselves and their scills, I suggest you look at some statistics!
Today we’ll talk about UX/UI designers, what do they do, what they do, what they do, how much they earn, how they work?! After studying the draft, I hope you don’t have any questions.
/01/ Where does the legs come from?
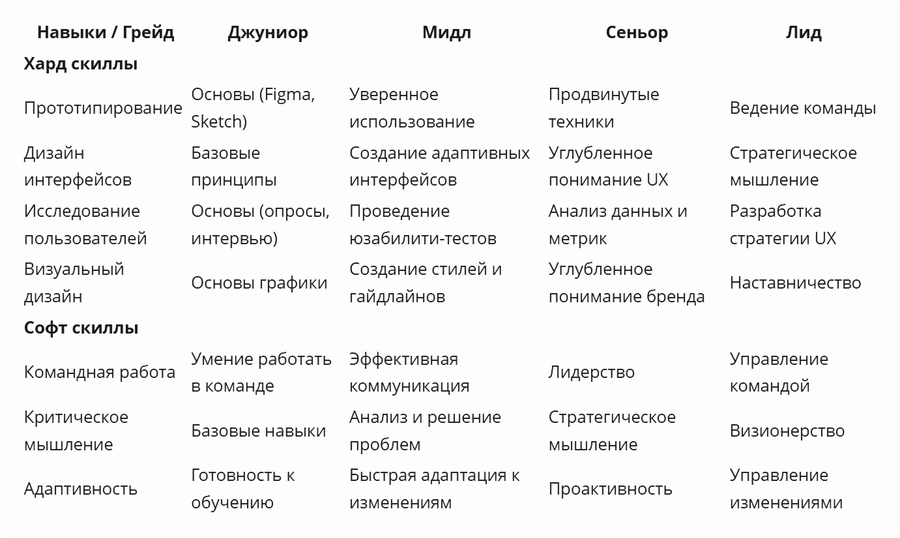
- Second year* Profile: Design and programming. Need: Professional work or internship. Most of the vacancies in my infopole are Ux/UI designer. How can you appreciate yourself? What do you need to be able to do? In my search for answers to these questions, I reread several articles. Asked GPT to draw up a summary table of skills and Grayds.
Greys to levels UX/UI designer — Kedu and a-href=»https://hagur.com/en/companes/tbank/articles/689214/«>Greeds in design: from Junior to Senior What should be able to Junior, Middle, Senior, etc. Designer — UX Puret-driet-umiet-junirids http://i-dheior's’s's <.hedhei-dhei-d/a’s's’s's’s===»
Promt and result:
Analyze these sites, compile a comparative table of skills and skeeks (Soft and Hard) of UX/UI designers on different greeds (Junior, Middle, Señor, Lead), consider which metrics will be used, how to make the table as well as to be as complete and informative as possible, based on the table, describe seven examples of metrics that can be shown in different graphs to make the table as visible as possible. The table must be lengthy, complete, detailed, with great attention to the details. Contact for table and analysis from open sources, list for specific articles below.
/02/ Linear diagram
This is where we learn how to design, how to do things quickly, and what skills to pump to grow up in a grade.
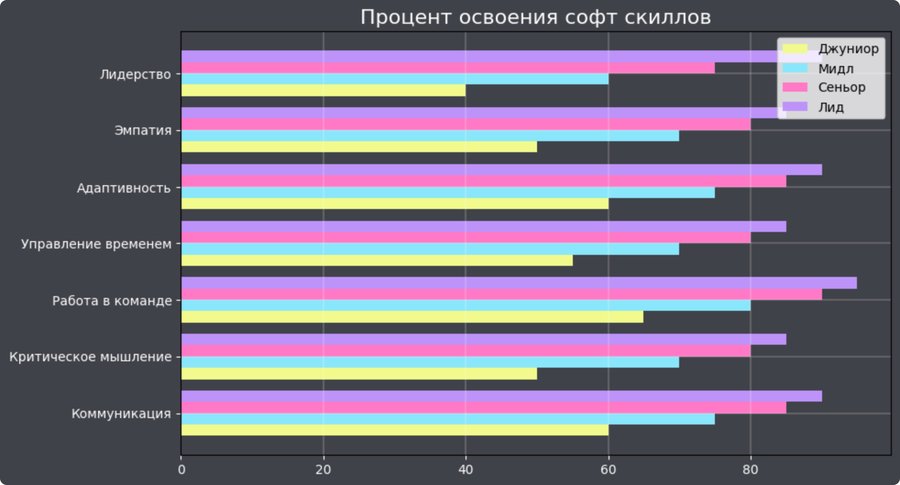
[How can I impregnate?]
Here we already import the tables and set the conditions for visualization, starting with the usual graphs with the columns.
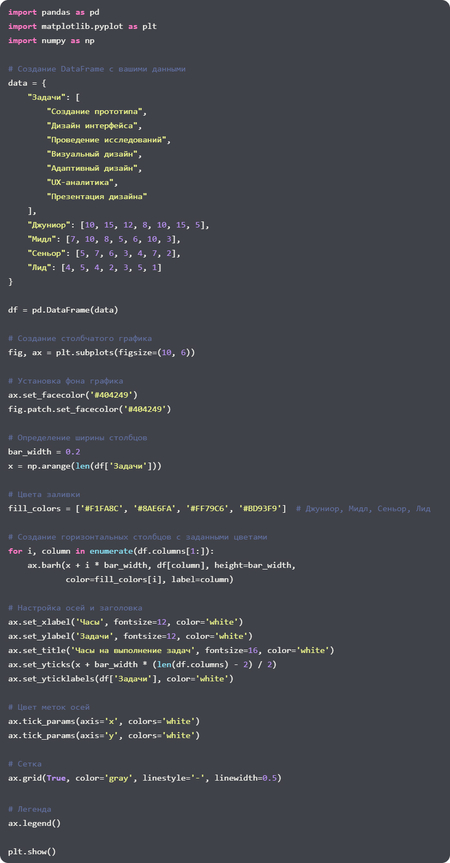
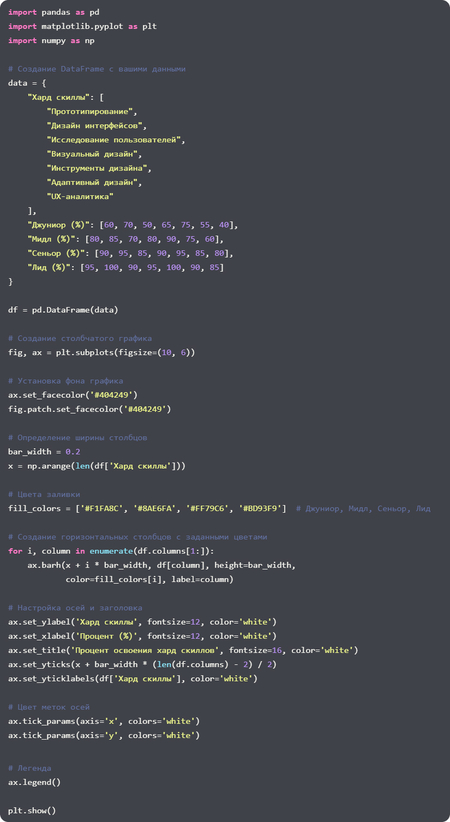
Stamps of the column chart and creation of Data Framework
Where’s the information coming from?
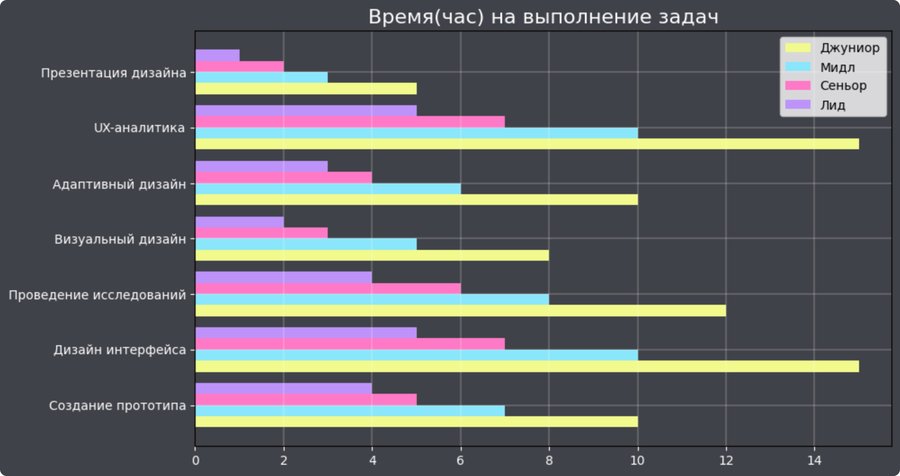
The first sign came out pretty, but… what if? Add a metric! Interest in skills, for example. To separate the hard and soft schills… and also to know how long it takes to complete the tasks) () ()) ()) © ©
Greys to levels UX/UI designer — Kedu and a-href=»https://hagur.com/en/companes/tbank/articles/689214/«>Greeds in design: from Junior to Senior What should be able to Junior, Middle, Senior, etc. Designer — UX Puret-driet-umiet-junirids http://i-dheior's’s's <.hedhei-dhei-d/a’s's’s's’s===»
Promt and result:
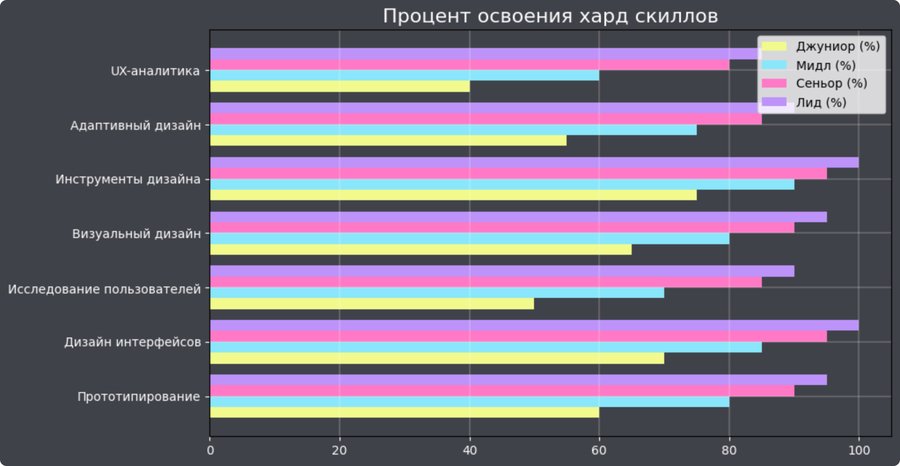
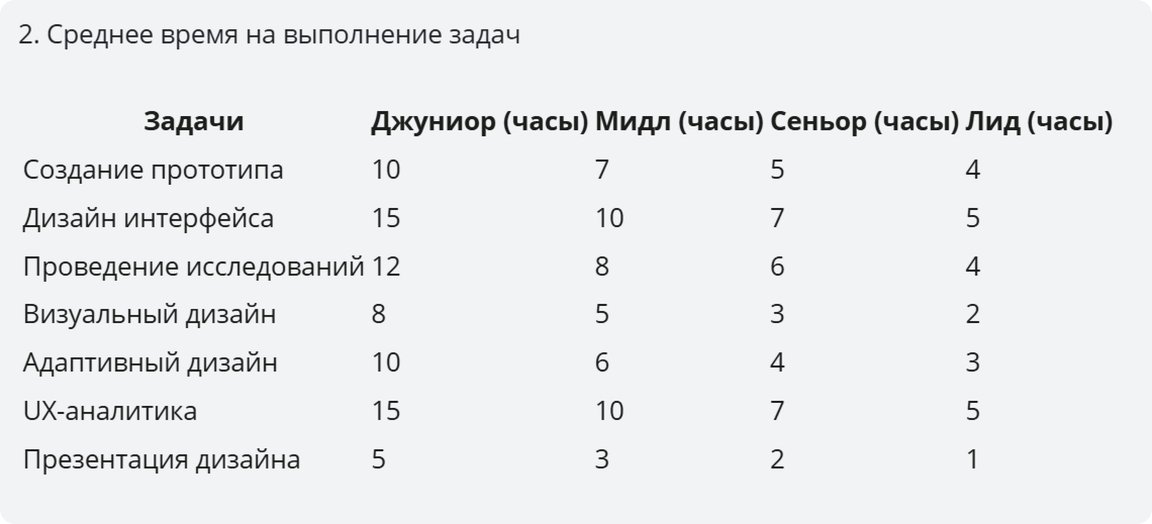
Based on the answer above and the articles previously considered, the compilation of summary tables for these criteria should produce three tables, with the requirement that each of the tables should show the Graydes (Junior, Middle, Señor, Lead). 1 Table: Percentage of hard skill learning: a graph showing the level of learning of each hard skill by Grayd. Table 2: Average time to perform tasks: a graph showing the average time required to perform typical tasks at each level. 3 Table: Skill software development: a graph showing the level of development of the Skill software (e.g. communication, critical thinking) for the Grayds.

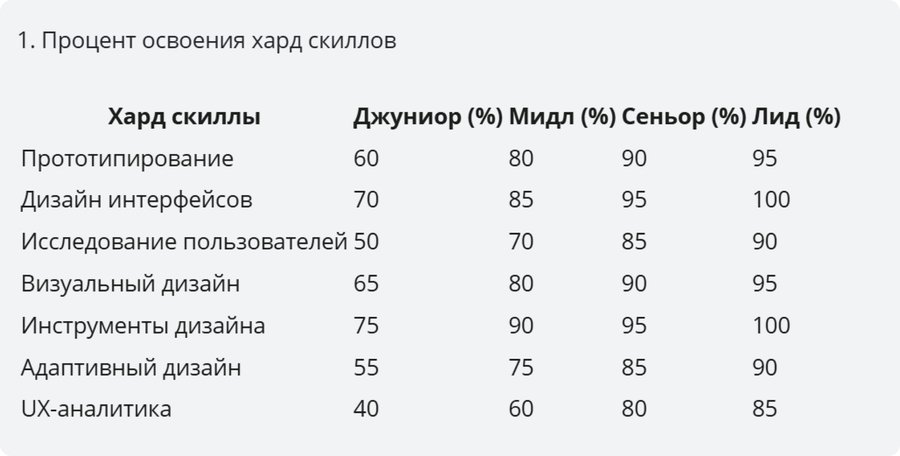
/03/ Exact graphs
Here we look at the experience of the years, the main hardbacks of scills and crap, depending on the habitat and the Gray!
In the Msk, the average P.A. looks attractive)
Designers don’t starve at Spb either…
You have to think seriously, Zp wants to be in the msk, but you like living in comfort, what do you do?
[How can I impregnate?]
First we move the signs, after a little bit of math, and we put on a style and we’re ready!
Data Frame Styles and the Creation of Data Frame
Where’s the information coming from?
Well, we’ve sorted out some skills. It remains to be seen where and what to expect. Found some other interesting articles….