Project Description
The issue of homeless animals remains one of the most significant social problems in many countries. Despite the diligent work of animal shelters, thousands of animals still need a home and care. This topic is close to my heart because I love animals, and I plan to adopt a pet from a shelter in the future.
Project Goal — to use data visualization to show who ends up in shelters, the reasons behind this, and what patterns can be identified in the collected statistics.
The Practical Benefit of this project lies in
raising awareness about the issue of homeless animals and promoting responsible pet ownership!
Infographics allow for a quick comparison of key indicators, reveal the scale of the problem, and form a more cohesive understanding of the lives of animals in shelters.
The project translates data analysis results into a visual form, making complex statistical information more understandable and accessible to a broad audience.
Image generated by the Recraft neural network. Prompt: Draw a kitten, puppy, rabbit, cat, dog on a white background in realism in beige tones
Source Data
For this research, we utilized the open dataset Animal Shelter Analytics, hosted on the Kaggle platform.
The foundation for this infographic was my previous data visualization project, which was completed as part of a curriculum module. Leveraging this previously analyzed dataset allowed us to build upon the theme and focus specifically on developing a visual language and methods for information presentation.
For the infographic, we selected metrics that most comprehensively reflect the core aspects of the stray animal issue: their condition upon intake, distribution by species, reasons for entering the shelter, and sterilization data.
Image generated by the Recraft neural network. Prompt: Draw two light beige cats and dogs sitting next to each other, realistically, on a white background
The Creation Process
Analysis and graph preparation were conducted in Google Colab using Python.
Based on the results of the previous study, indicators that most comprehensively reveal the issue of stray animals and the work of shelters were selected.
*The following libraries were included:
pandas (for importing, cleaning, and processing tabular data), matplotlib.pyplot (for generating charts), font_manager from the matplotlib library (for connecting and configuring fonts in the graphs).
The CSV file was uploaded to the local storage of Google Colab, subsequently imported into the working environment, and converted into a DataFrame table format.
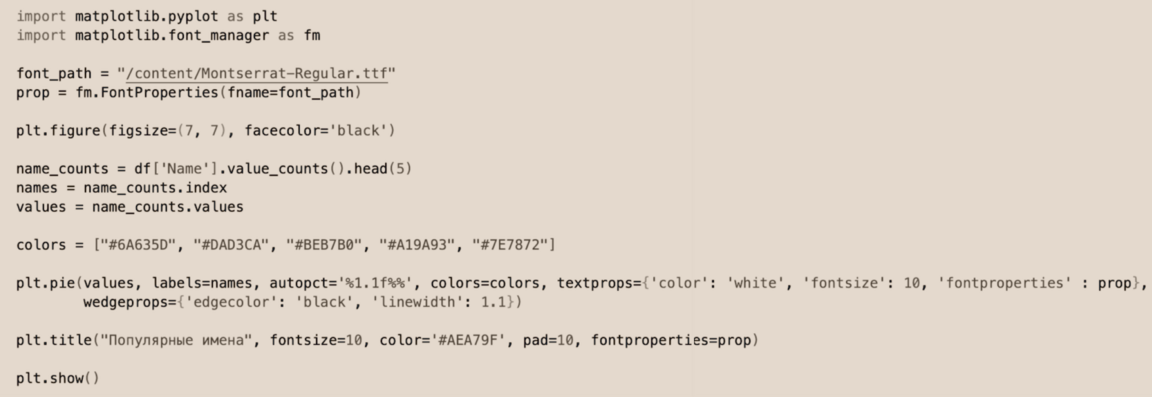
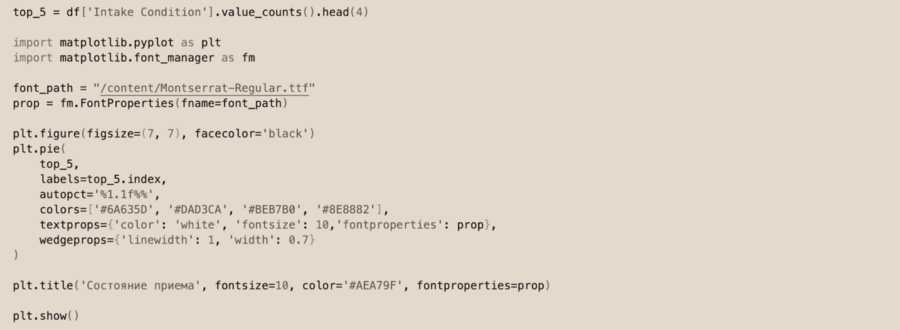
Code snippet examples for generating charts from the previous module’s project
After processing the data, a visual concept for the project was developed, encompassing a color palette, typography, and a system of graphic elements.
The illustrations of the animals were created using the neural network Recraft, and were subsequently refined in Adobe Photoshop.
The final layout of the project was executed in Figma, where the diagrams, textual materials, and illustrations were integrated into a unified visual system.
Poster and Media
The carrier for the infographic is an A2 vertical poster. Its composition is built on the principle of sequential storytelling: the viewer is first introduced to the problem of homeless animals, and then systematically explores the main research findings and key statistical indicators.
A2 vertical poster
The visual design employs a soft, creamy-brown palette, which helps establish an atmosphere of care, warmth, and trust.
To enhance the emotional resonance, the composition incorporates images of animals, allowing for a closer connection between the viewer and the research topic.
The combination of analytical data and visual imagery helps not only present statistics but also to remind us that
Behind each number is the real story of an animal awaiting its forever home.
Data analysis shows that most animals that end up in shelters have a good chance of being adopted into a family; however, the problem of homelessness and insufficient sterilization remains a pressing issue. I hope that this work
will help draw attention to the work of animal shelters and remind people of the importance of responsible pet ownership.
Tools Used
Kaggle — Sourcing and downloading the raw dataset. Google Colab — Data analysis and chart generation. ChatGPT — For generating ideas for graphs. Recraft — Generating animal illustrations for project design. Adobe Photoshop — Processing and preparing graphic materials. Figma — Developing the poster composition and preparing the final layout. Google Fonts — Utilizing the Montserrat typeface.