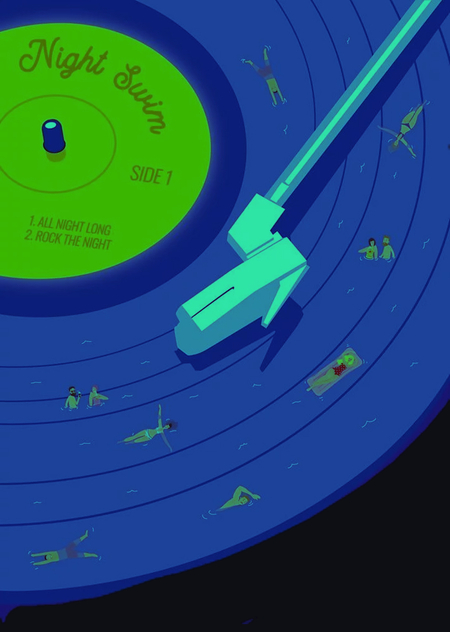
Concept
Music accompanies us every day: on the way to school or work, during leisure time, while exercising, or simply when we want to be alone with our thoughts. Everyone uses music differently—some seek energy from it, others find a way to relax, and still others look for support during difficult periods of life.
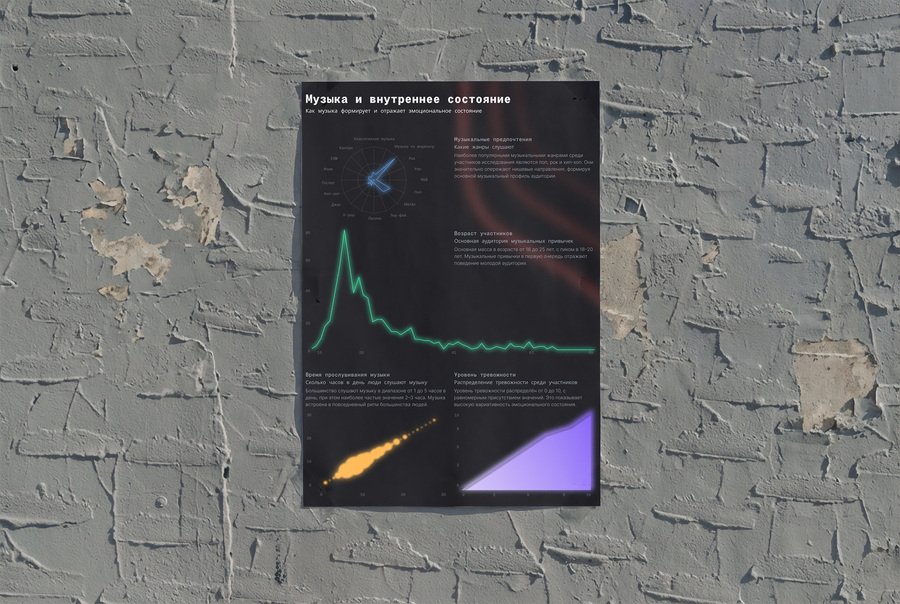
The core idea is to demonstrate how people interact with music and the role it plays in their daily lives. The goal is to make the results clear and visually engaging, while also identifying the degree to which music is connected to the individual.
Infographics and Mockups
Process Description
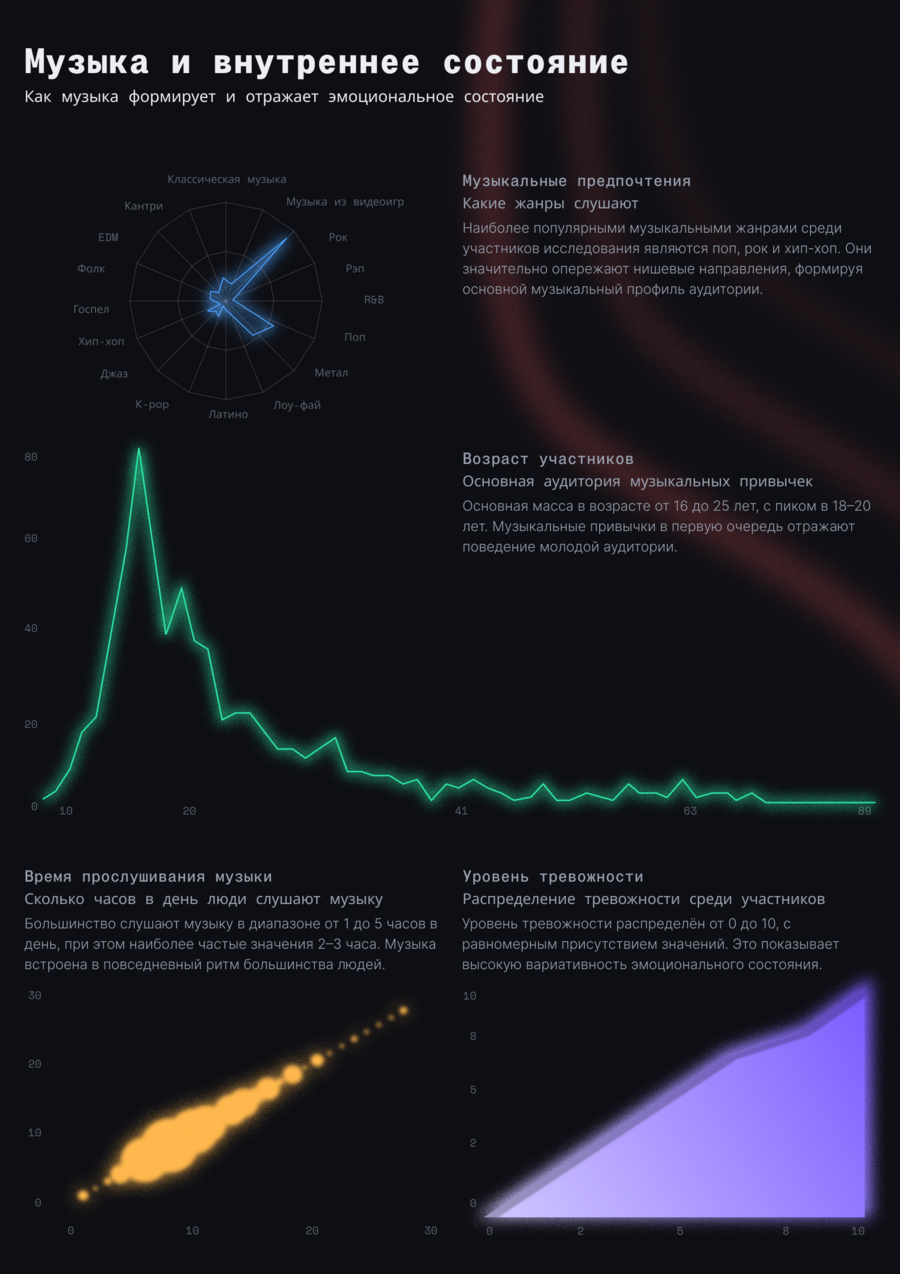
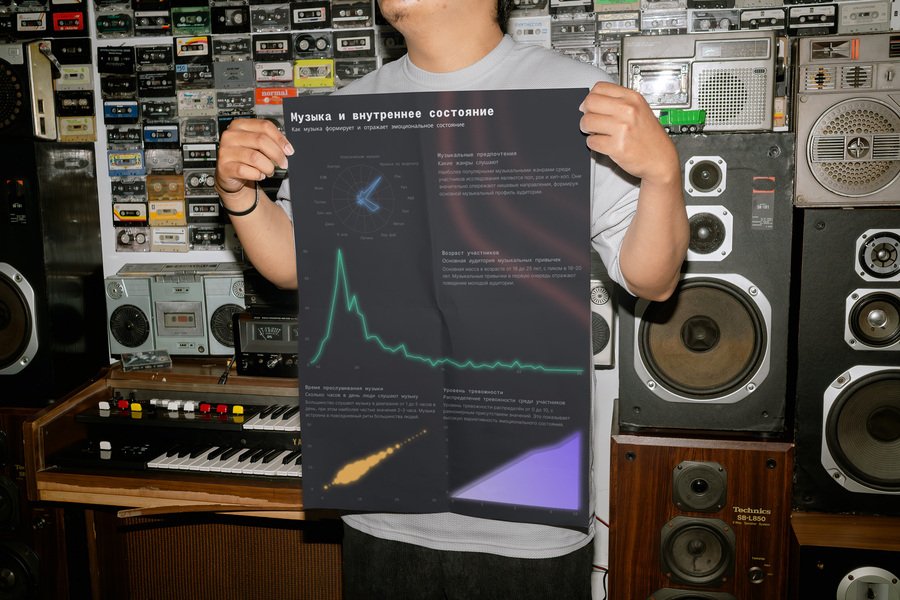
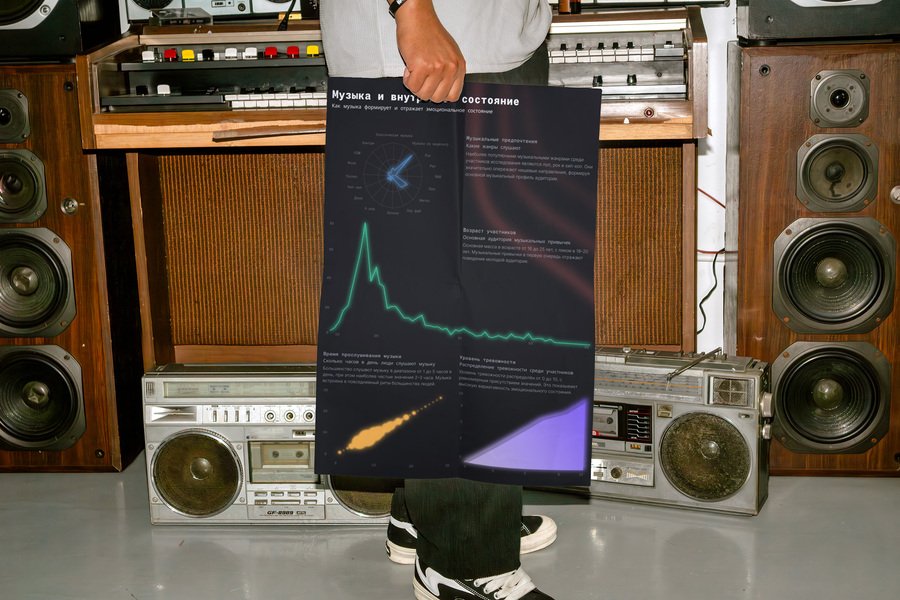
The project work began with an analysis of the dataset structure in LibreOffice. Key groups were identified: age, musical preferences, music listening intensity, and emotional state indicators. During the data preparation phase, the data was verified and added to pivot tables. Charts were generated using these tables.
In the final stage, the most legible chart types were selected in Figma, a clear hierarchy and unified style were established, and appropriate fonts and a color palette were chosen.
Each visualization addresses a specific question, and together they form a cohesive narrative without the need for further explanation.