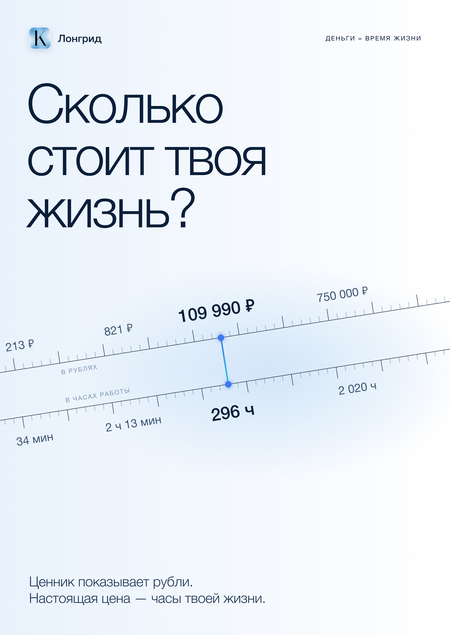
«How much is your life worth?» — an interactive long-form piece exploring the idea that money can be measured in hours of life. I created it for the «Digital Product Design and Promotion» course at HSE as a channel to introduce the audience to the concept behind the financial application KASHER. The product itself is not shown in the long-form piece; rather, the long-form piece sells the idea, not the interface. I did everything myself: I gathered and verified the facts, wrote the copy, and developed the visual language. Then, I designed the mockups in Figma, assembled the page with animations, and deployed it on Tilda.
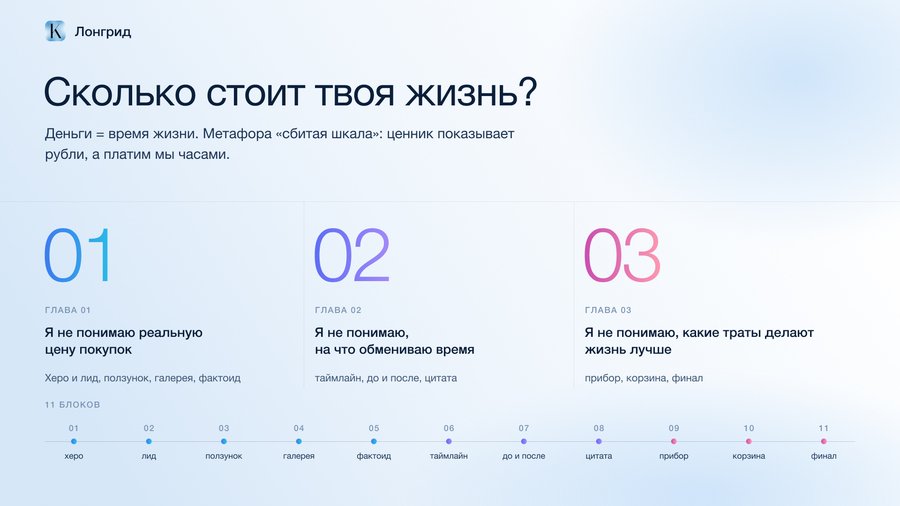
At the core is the metaphor of the «broken scale.» The price tag shows rubles, but we pay with the hours we exchanged for those rubles—a cost that isn’t listed on the tag. The chapters are built upon three first-person admissions: «I don’t understand the true cost of purchases, ” „I don’t understand what I’m trading my time for, ” and „I don’t understand what kinds of expenditures actually improve life.“ Each chapter addresses one of these misunderstandings, and together they form 11 blocks.
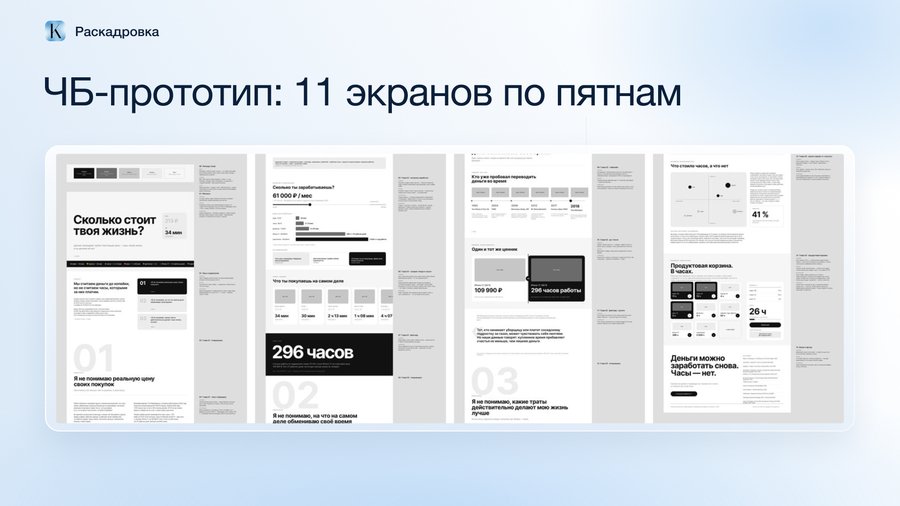
First, I assembled a black-and-white prototype of 11 screens over five days, without color or imagery. This makes it easier to test the rhythm—where the reader might tire of the text and where a scene or a large figure is needed.
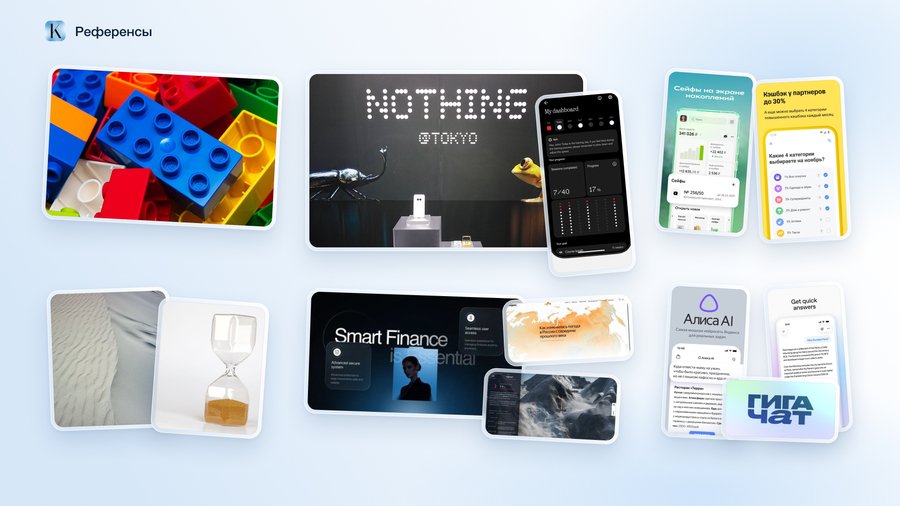
I gathered references based on three key objectives. Sand and hourglasses conveyed the feeling of fleeting time. The point typography from Nothing served as the foundation for the text elements, which are assembled from dots. LEGO bricks suggested the technique of dots and their morphing. I observed modern AI assistants and financial applications for the light gradients and glass effects—the theme of money should not appear alarming.
Long text about money is easy to skip, so this long-read alternates between three modes: narrow text, a full-width scene, and a large numeral. Every one or two screens, the reader is met with an event.
The first screen greets the visitor with a question composed of dots. As the user scrolls, the dots fly apart and then gather into three main card sections, so the title instantly transforms into a table of contents.
The main interactive element at the end is the basket. The reader drags their weekly spending into it and sees not the sum, but the hours of life spent. The basket highlights expenditures that have passed the three questions from Robin and Dominguez: Did this expense bring joy? Does it align with your goals? Would you keep it if you didn’t have to work for money?