
Idea and Concept
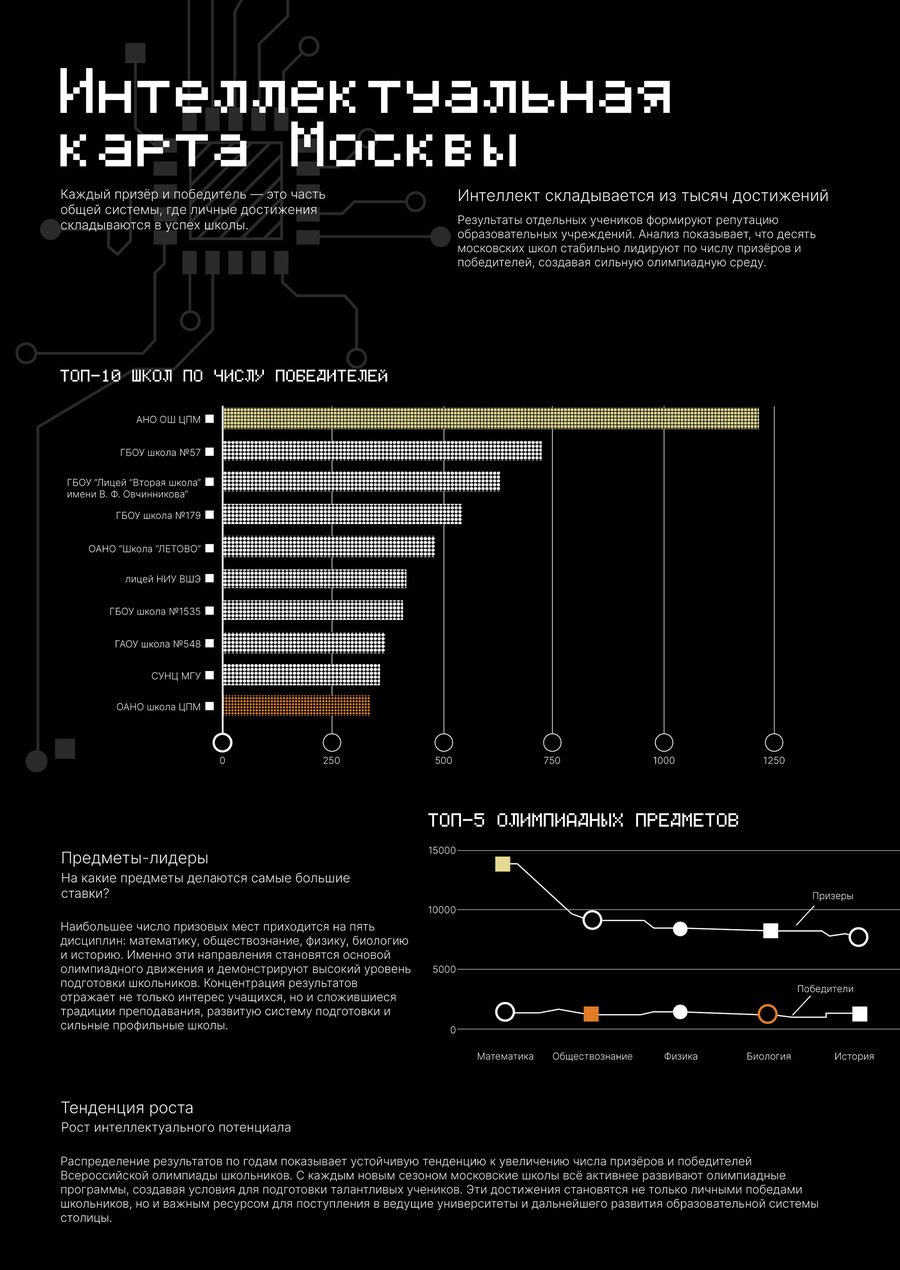
The core of my project involves data on prize winners and champions from Moscow school Olympiads. I chose this topic from a previous project because I find it relevant and it allows for a clear demonstration of which schools and specializations achieve the best results. Such data helps viewers better understand the overall landscape of the city’s Olympiad movement.
The main idea of the project is to illustrate that every student is part of a larger process, and it is through their achievements that the school rises in rankings and achieves high results. This is reflected in the visual solution through the image of a system, where individual accomplishments function as elements of a single mechanism. This approach helps the audience perceive the data as a unified structure, making the information clearer and more visually compelling.
The Goal and Value of Infographics
The goal of this infographic is to illustrate which schools and subjects are most frequently associated with Olympiad victories. The poster helps viewers quickly identify the leaders and understand in which areas students are achieving the greatest success. This information can be useful for students and parents when choosing a school and understanding the opportunities within the Moscow Olympiad movement.
Poster
Process Description
For this project, I utilized data from Google Sheets, where the initial set of information was gathered and structured. The concept and rough layout of the poster were developed during the homework assignments. Afterward, I formulated the project’s goal and concept, choosing the visual metaphor of a microchip because it best suited my intention. The core work on the poster involved constructing the charts and integrating them into a cohesive composition (first in Google Sheets, followed by stylization in Photoshop). I only used the neural network at the final stage—to refine the cover design.
Infographics mockups