Feminine Wardrobe Atlas is a project examining archival feminine aesthetics that are currently resonating in contemporary fashion through brands like Sandy Liang, Miu Miu, Simone Rocha, and others. Rather than analyzing social media trends, the project draws upon museum archives to demonstrate how the visual language of whimsical girlhood is constructed.
Contemporary girlhood aesthetics are often perceived as a fleeting visual trend: bows, pearls, ballet flats, soft silhouettes, doll-like charm, and archival delicacy. Yet, many of these looks are not new—they already exist within the history of costume.
The project’s goal is to examine this aesthetic as an archival wardrobe—a system of items that recurs, changes, and acquires new meanings across different eras. The infographic illustrates which categories of items form this wardrobe, when individual pieces became particularly notable, and how the archive gradually transitioned from anonymous objects to items associated with specific designers and fashion houses.
DATA
For the project, The Met Open Access Dataset was selected because it contains structured data about fashion artifacts: dates, names, categories, and authorship. This allows for the analysis of aesthetics through real archival objects, rather than solely through visual associations.
Objects from the Costume Institute department were selected from the dataset. The analysis included items dated from 1700 to 2025. The basis for grouping was the object names: dresses, footwear, headwear, soft goods, small accessories, jewelry, skirts and blouses, and corsets.
Data Source: The Met Open Access Dataset / MetObjects.csv Link: https://github.com/metmuseum/openaccess Filter: Department = Costume Institute Period: 1700–2025 Method: Grouping objects by wardrobe category names; calculating object counts, peaks by decade, the proportion of ornaments, and the proportion of objects with a specified artist.
The poster is structured like an archival page: visual data is transformed into a wardrobe, a rail, a string of pearls, and a set of clothing tags. This approach allows statistics to be conveyed not only through numbers but also through the material language of fashion.
dark mode poster
light theme of the poster
SCHEDULES
Schedule No. 1
fig. 1 — «Whimsical Wardrobe» — shows the number of objects by category. Dresses constitute the largest portion of the archive, while shoes, hats, soft goods, accessories, and jewelry gather around them to form a decorative world.
Schedule #2
fig. 2 — «Peak Rail» — shows the decades in which each category appeared most frequently. It functions as a wardrobe timeline: different items are «hung» on the rail during their archival peaks.
Schedule No. 3
fig. 3 — «The Pearl Line» — illustrates the proportion of jewelry in wardrobes across decades. The larger the pearl, the greater the role of accessories in the style of that era.
Schedule #4
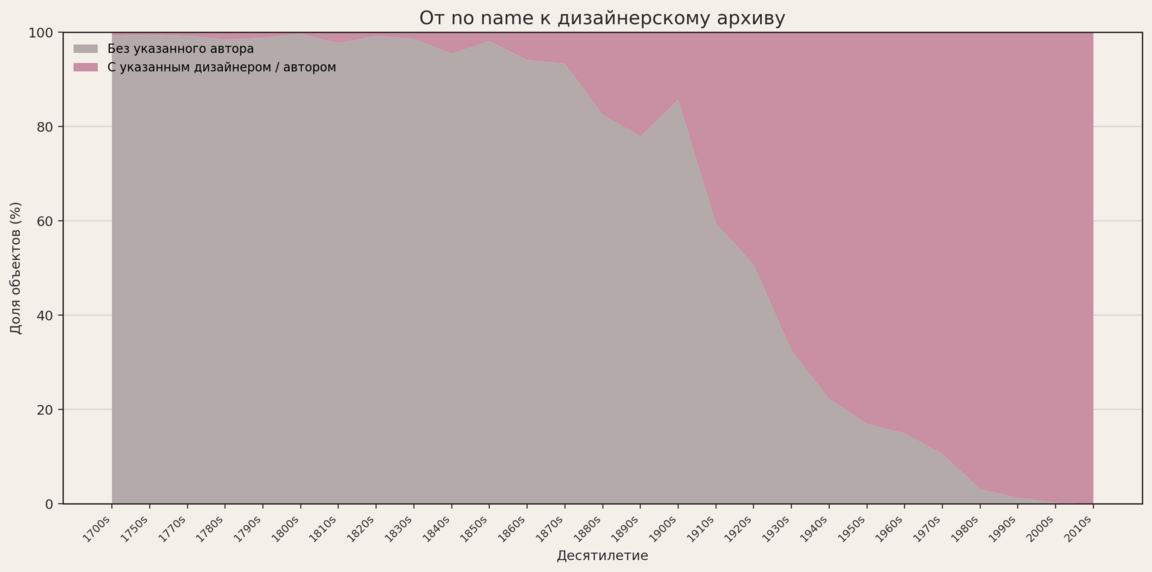
fig. 4 — «From No Name to Design Archive”—illustrates how the fashion archive gradually shifts from anonymous items to objects associated with specific designers and fashion houses.
VISUAL LANGUAGE
The project’s visual system is based on the image of an archival fashion page: thin lines, sketch-like illustrations, tags, captions, wardrobes, threads, beads, and paper texture. This style supports the wardrobe theme and integrates the data into the aesthetic itself.
The poster avoids a dry, diagrammatic presentation. Instead, each chart is transformed into an object metaphor: categories become shelves in a closet, peaks become items on a rail, embellishments are rendered as a string of pearls, and authorship is represented by a set of museum tags.
PROCESS
The work began with selecting a theme and sourcing a dataset that would allow for an exploration of the feminine/whimsical girlhood aesthetic through real archival data. After selecting The Met Open Access Dataset, the data was processed in Google Colab.
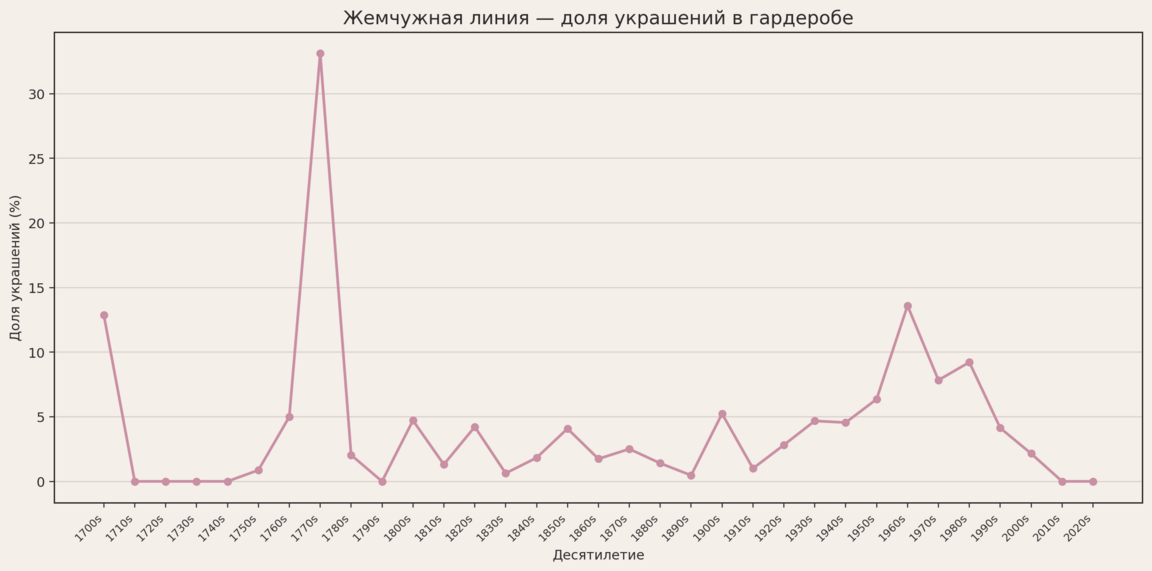
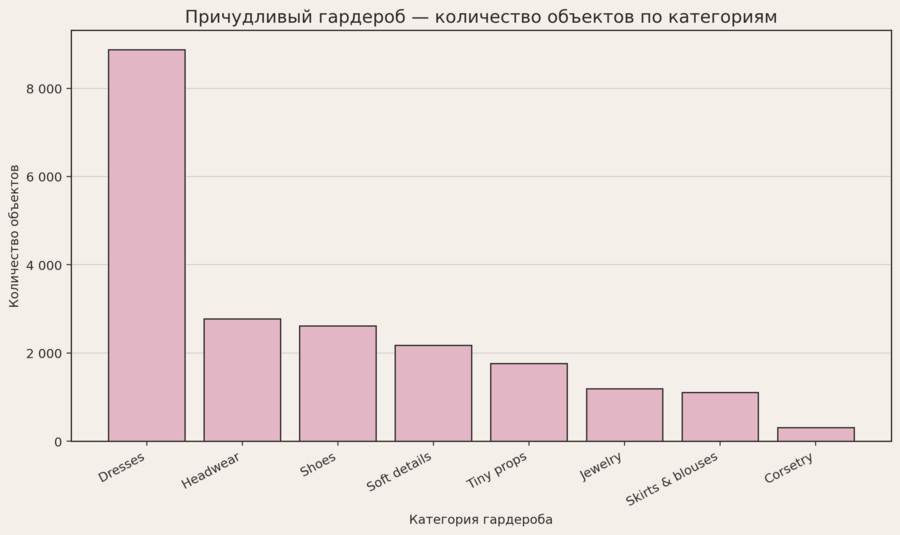
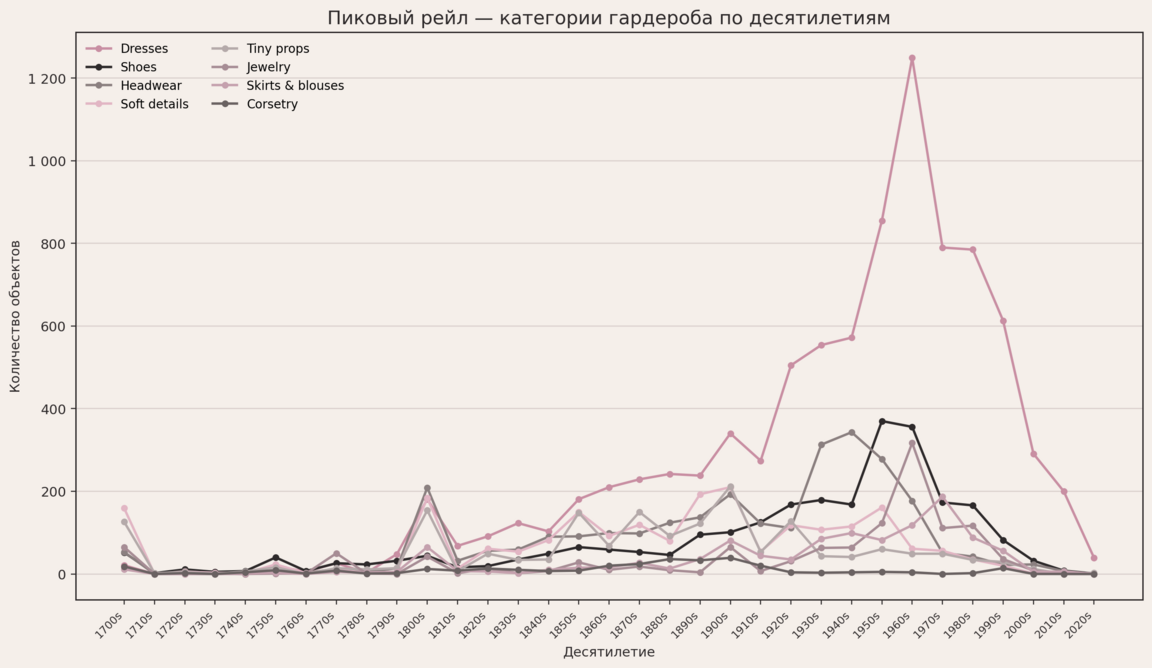
Starting Schedules
First, objects from the Costume Institute were filtered out of the general dataset. Next, the items were grouped by wardrobe type based on the object names. Following that, the total counts per category, decade-specific peaks, the proportion of accessories in the wardrobe, and the proportion of objects designated with a specific designer or author were calculated.
The resulting conventional charts were used as a baseline for verification. They were then manually transformed into a visual poster system: a cabinet, a rail, a pearl line, and archival tags.
MOCKUPS
Poster for the Kids' School
Poster in a women’s clothing store environment