
Description

In the modern world, maintaining a healthy lifestyle has become more than just a beneficial habit—it’s a genuine trend. My personal interest in this subject dates back to my childhood: I started artistic gymnastics at the age of four, and since then, issues of physical activity and healthy eating have always been relevant to me. Even now, while attending the gym, I continue to stay in shape and deepen my knowledge of sports.
This is precisely why, when I needed to select data for analysis within a project, I turned to the dataset «Gym Members Exercise Dataset, ” available on the Kaggle platform. This dataset contains information about gym visitors, their workouts, and their physical metrics.
Several types of graphs and charts were created during the information analysis: — Bar Chart (Histogram) — Pie Chart — Box Plot — Scatter Plot — Violin Plot — Dot Plot
Visual Concept


Prompt: A futuristic gym filled with puppies of different breeds training on professional machines. One puppy lifts dumbbells, another runs on a treadmill, a third does stretches on a mat. The atmosphere is energetic and fun, the lighting is soft, with neon accents. The gym’s design is modern, featuring mirrors, fitness equipment, and stylish details.
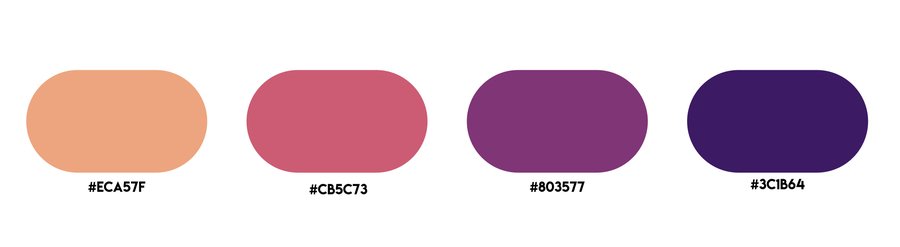
The Lemon/Milk font (RUS BY LYAJKA) was selected for the charts and their titles.


Prompt: A futuristic gym filled with puppies of different breeds training on professional machines. One puppy lifts dumbbells, another runs on a treadmill, and a third does stretches on a mat. The atmosphere is energetic and fun, with soft lighting accented by neon. The gym’s design is modern, featuring mirrors, fitness equipment, and stylish details.
Data Visualization
Visitor Age Distribution for the Gym
The chart analysis reveals several key observations. First, the age distribution among gym visitors is not uniform. The graph clearly shows several peaks, indicating the presence of distinct age groups that are most actively using the facility.
Three primary age groups stand out: approximately 20–25 years old, 40–45 years old, and 50–55 years old. These groups account for the largest number of visitors.
Visitor distribution in the gym by Body Mass Index (BMI) category
A significant portion of visitors is overweight or obese, which underscores the role of the gym in improving physical fitness and health.
A small fraction of visitors with low body weight may indicate a desire to build muscle mass or improve overall health.
Distribution of burned calories by workout type
The chart illustrates the differences in burned calorie distribution across various exercise types. Each «box» on the chart displays the median, quartiles, and outliers for the corresponding exercise type. The median, represented by the line inside the box, indicates the average calorie burn. The quartiles, shown by the box boundaries, represent the spread of values within the 25–75% data range. The «whiskers» show the spread of values outside the quartiles, and points beyond the «whiskers» are considered outliers (an outlier is a value that deviates significantly from the other values in the dataset).
HIIT and Strength training sessions exhibit the widest range in calories burned and the greatest number of emissions, suggesting the high variability in the intensity of these workouts.
The median calories burned for HIIT and Strength training is higher than for Yoga and Cardio, indicating that these types of workouts require more energy.
Yoga and Cardio training sessions show a smaller range in calories burned and fewer emissions, pointing to a more stable and predictable level of energy expenditure.
Maximum heart rate by age
The chart shows that the data points are scattered fairly uniformly across the entire age range, suggesting a weak correlation between age and maximum heart rate.