
Project idea, concept, and objective description
The project focuses on the growth in the number of games on the Steam platform between 2004 and 2018.
The topic was chosen because Steam is one of the primary digital platforms for game distribution, and the increasing number of releases effectively demonstrates the saturation of the modern gaming market. The project’s goal is to illustrate this growth through the metaphor of a «digital avalanche» and make the data accessible to the viewer.
The infographic is presented in A2 poster format. Each tile on the poster represents 100 games, and the overall movement of the tiles illustrates how Steam’s compact storefront gradually transforms into a dense stream of releases. The project can be used as a poster in educational or exhibition settings related to gaming, digital platforms, and data visualization.
Data Selection and Creation Process
The Steam Store Games Dataset was used for this project. The primary field for analysis was the game release date. The year was extracted from this date, and subsequently, the games were grouped by year.
Analysis Period: 2004–2018. Metric: Number of games per release year. Visualization Scale: 1 tile = 100 games. Tools: Python, RAWGraphs, Figma.
*These data do not claim to provide an exhaustive description of Steam’s entire history; they are used as a dataset for the visual analysis of release dynamics and the construction of an infographic narrative.

The source CSV file was processed using Python. The release year was extracted from the release_date field. Then, the data was grouped by year to create a table showing: year — number of games.
After processing, a basic chart was built to examine the overall growth trend. At this stage, RAWGraphs was used as a tool for a quick check of the data structure and visual direction.
The standard bar chart was replaced with a tile system. The scale chosen was one tile per 100 games. This decision allowed us to illustrate not only the numerical difference between years but also the visual sensation of accumulation.
The final poster was assembled in Figma.
Infographics
Result
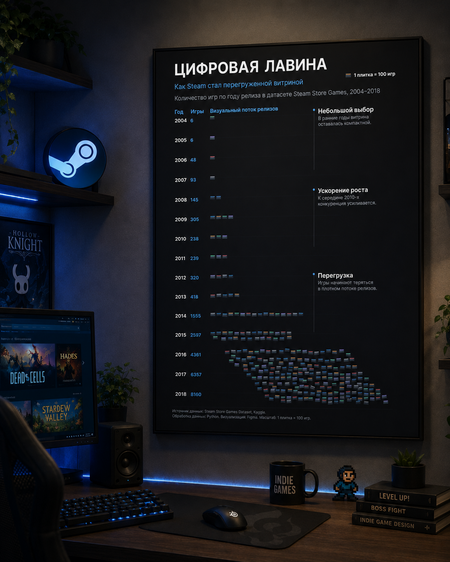
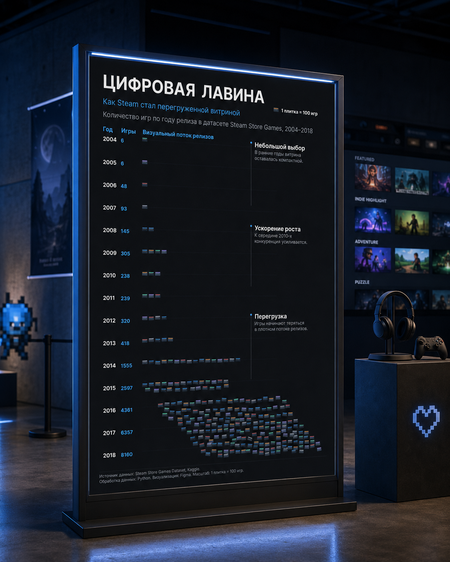
The Chat GPT neural network was used to generate the cover and mockups.