
Project Description
This project is a deep dive into data concerning Pixar films—a studio that has created not merely animated features, but cultural phenomena, for nearly 30 years. I decided to analyze this specific data to uncover the secret behind their unprecedented success: how the studio manages to balance creative innovation with commercial viability across decades. The dataset from Kaggle contains comprehensive information on all Pixar films, from Toy Story (1995) to Inside Out 2 (2024)—including budgets, worldwide gross, and critic and audience ratings.
I wanted to examine Pixar’s history of success through data: to trace how their financial metrics have evolved, how their global audience has grown, and which films have proven to be not only box office hits but also the most profitable projects.
I found a suitable dataset on Kaggle and utilized Google Colab for the data analysis.
Visualizations and their justification
I selected five types of charts, each revealing a different facet of the data:
Area Line Chart — to illustrate the trajectory of the studio’s global box office revenue from its first film to its last.
Grouped Bar Chart — to clearly compare which films generated the most revenue and which achieved worldwide hits.
Horizontal Bar Chart — to rank the films based on a key business metric—Return on Investment (ROI).
Word Cloud — to create a vibrant, memorable textual map of the Pixar universe, where the size of the word corresponds to the franchise’s significance.
Scatter Plot with Regression Line — to investigate whether there is a direct correlation between budget size and box office performance, or if success is driven by something else.
Color Palette Selection
When developing the color palette for the charts, I drew inspiration from the Pixar animated film «Soul.» I wanted to convey the same creative and slightly enigmatic atmosphere present in the movie. Therefore, I chose muted purple and lilac tones, reminiscent of otherworldly realms, incorporated calm turquoise hues as a symbol of life’s flow, and added deep blues associated with a nocturnal city and jazz.

«Soul» (2020)
Palette created in Gradients.App
Visual Style Code
Schedule 1
Schedule 1
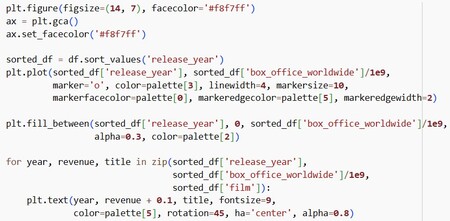
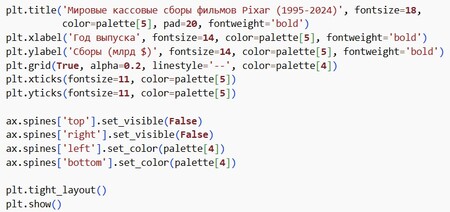
Schedule 1, code
This chart shows whether their films have earned more money over time. What is visible: A clear growth trend! Pixar films generate increasing revenue every year. The surges in certain years are particularly noticeable—these correspond to the release of mega-hits. The biggest jump is seen in the 2010s.
Schedule 2
Schedule 2
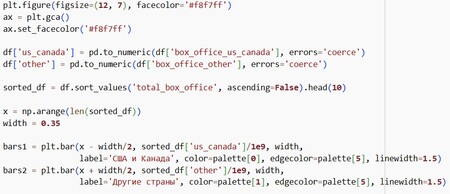
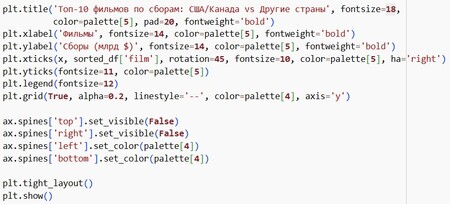
Schedule 2, code
I was curious where Pixar earns more—at home in the US or globally? This illustrates the worldwide popularity of their animated films.
It turns out that the global market is massive for Pixar. Nearly all of their top films feature strong viewership figures from other countries. This means that Pixar’s stories are understood and beloved all over the world, not just in America.
Schedule 3
Schedule 3
Schedule 3, code
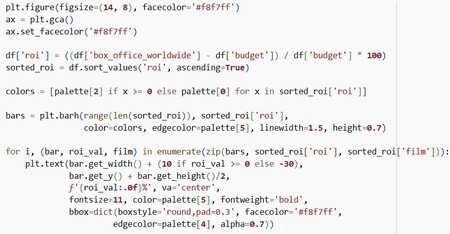
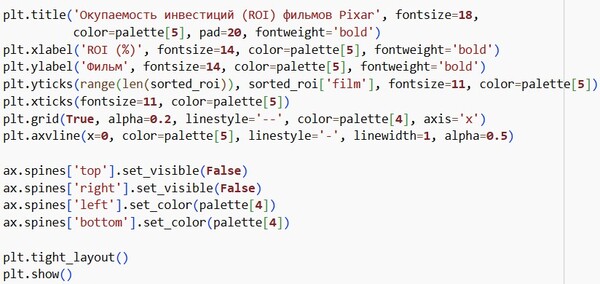
This is the most critical chart for the studio. It answers the question: Did the animated film pay for itself? The percentage shows how many times the budget was recouped.
Almost all films were profitable, and very highly so. Many were recouped 4–5 times over. This is a phenomenal result and explains the studio’s success. Only one or two projects yielded modest profits; there are absolutely no losses.
Schedule 4
Schedule 4
Schedule 4, code
The largest and most prominent words are, of course, their main hits and franchises. You can immediately see which titles are well-known: «Toy Story,» «Cars,» «Finding Nemo.» The word cloud beautifully illustrates that the studio has its own «star» brands.
Schedule 5
Schedule 5
Schedule 5, code
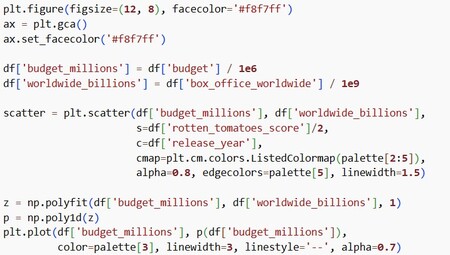
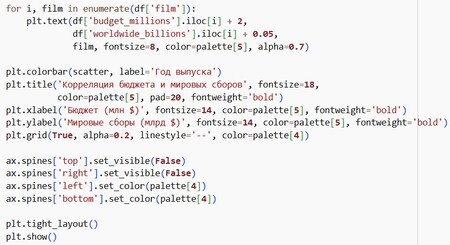
The larger the circle—representing the budget—the higher the fees are typically, and the higher the returns. The black dashed line confirms this trend. However, there are surprises too: some films with not the biggest budgets, smaller circles, have soared very high. This means that success isn’t solely about money, but also about a brilliant idea.
«Soul» (2020)