
Concept
The automotive industry is a key sector of the global economy, and the stocks of major manufacturers reflect not only the state of the companies but also global economic trends. Mercedes-Benz, one of the most renowned producers of premium vehicles, is of particular interest—its shares have reacted over decades to financial crises, technological shifts, and the transformation of the automotive market.
For the research, a dataset of historical Mercedes-Benz stock market data was selected, containing information on opening and closing prices, maximum and minimum stock values, and trading volumes from 1996 to the present.
I was interested in tracing how the company’s stock price changed over nearly three decades, which periods were characterized by the highest volatility, and how investor activity evolved. The project’s goal is to use data visualization to illustrate the long-term trajectory of Mercedes-Benz stock, identify the relationship between price, volatility, and trading activity, and present complex financial data in an accessible graphical form.
Data Visualization Analysis
Line chart and trading volume chart
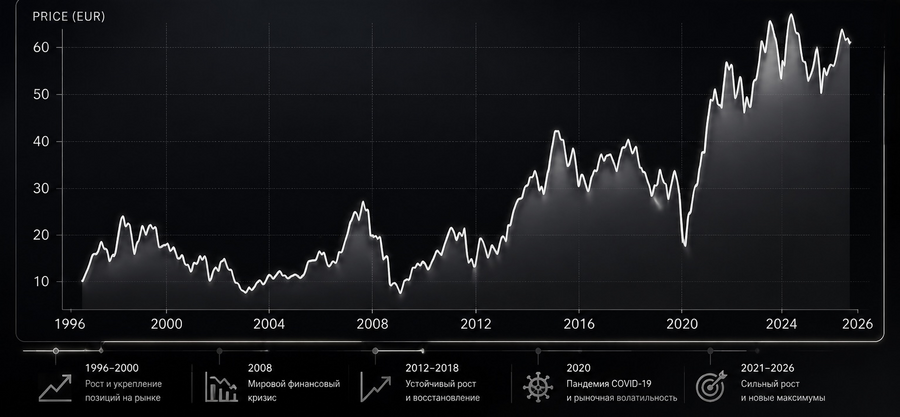
The line chart reflects the long-term dynamics of Mercedes-Benz stock value over a 30-year period.
The analysis reveals pronounced market cyclicality:
— periods of growth are succeeded by correction phases; — crisis events lead to sharp declines in value; — subsequent recovery is accompanied by the establishment of new local highs.
The years 2008 and 2020 stand out particularly, marked by steep value drops associated with global economic crises. Following these phases, the market demonstrates recovery growth, indicating the company’s resilience to external shocks.
Range Diagram
The boxplot displays the statistical distribution of stock prices by year, allowing for an assessment of market volatility.
Conclusions:
- During crisis periods, the range of values increases (rising uncertainty);
- In stable periods, the distribution narrows;
- After 2013, there has been an overall increase in the price range.
The most pronounced changes were recorded in 2008 and 2020, when the market experienced maximum instability.
Heatmap of Market Activity
The heat map illustrates the distribution of trading activity across months and years.
The analysis reveals that:
- Trading activity is unevenly distributed over time;
- Activity peaks coincide with periods of high volatility;
- An increase in the number of transactions is observed during crises.
This confirms that market participants respond more actively to instability, increasing trading volumes during sharp price changes.
The Creation Process
Project work began by studying and preparing a dataset containing information on Mercedes-Benz stock quotations.
During the processing phase, the data were cleaned and structured. Using Python and the Pandas library, key statistical indicators were calculated, periods of maximum stock price growth and decline were identified, and trading volumes were analyzed.
After preparing the data, visualizations were created to explore the dynamics of quotations from various perspectives. ChatGPT was used to design the artistic elements of the charts, mockups, and cover.
The final poster is styled like a modern financial dashboard, featuring a dark theme and high-contrast data visualization.
Poster Mockup
The visual solution was built upon the aesthetics of modern financial terminals and analytics dashboards. A dark background is paired with contrasting accent colors that highlight growth, decline, and key market indicators.
The color palette draws inspiration from the Mercedes-Benz corporate identity and financial analytics: the combination of deep tones, silver elements, and vibrant accents helps emphasize the most crucial data while maintaining an association with a premium automotive brand.
Holders
The infographic poster was adapted for display in urban environments, exhibition spaces, and educational projects focused on data analysis and financial visualization.
To present the project, mockups were created showing the poster placed on billboards, information stands, and exhibition surfaces.
Conclusion
Analysis of historical data indicates that the price of Mercedes-Benz shares has significantly fluctuated due to economic cycles, shifts in the automotive market, and investment activity. Despite periods of high volatility, the long-term trend demonstrates the company’s ability to adapt to the changing conditions of the global economy.
The study also shows that periods of significant stock price fluctuations were often accompanied by increased trading volumes, which suggests heightened investor interest in the company during crucial market shifts.
Mercedes-Benz Stock Data Dataset (1996–2026): https://www.kaggle.com/datasets/bsthere/mercedes-stock-data-1996-2026